




Solar forecasting in China
China added 240 GW of photovoltaic capacity in the first nine months of 2025 alone. By the end of September, installed capacity reached 1,126 GW, up 45.7% year on year, split between 617 GW of utility-scale plants and 508 GW of distributed generation. Over the same nine months, solar plants produced 916.3 TWh, an increase of 44.1%.
One number in that series matters more than the others. The national utilization rate was 94.7%. That figure means 5.3% of available solar output was not delivered, roughly 50 TWh over three quarters, more than Portugal consumes in a year.
What changed in 2025: the single tariff is gone
For most of the last decade a Chinese photovoltaic plant sold its output at a single administered tariff. Its own forecast error had little bearing on its revenue.
That is over. The single tariff has been removed and photovoltaic prices now have to adjust to market mechanisms. A plant that sells into a provincial market carries its own deviation: producing less than declared, or more, is settled. Forecast quality stopped being a compliance formality and became a revenue variable.
The market structure amplifies the effect. China counts roughly 35,000 electricity producers and 4,409 distributors. Most green power contracts run for less than five years, so few operators can hide a forecasting weakness behind a long-term price guarantee.

Solar in China: the market in figures
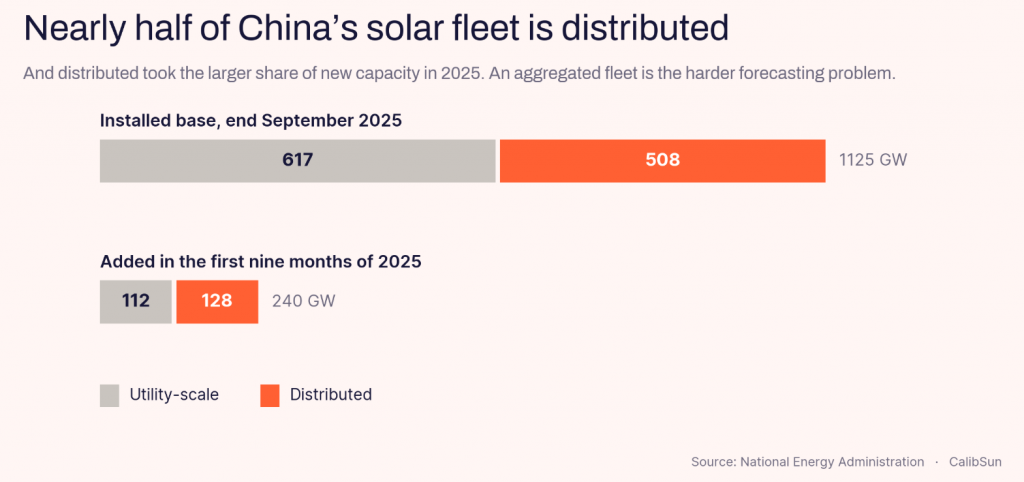
China is the largest photovoltaic market in the world by a wide margin, and it is no longer growing only in size. It is changing in nature. Distributed generation now represents 508 GW, close to half of the installed base, and it took the larger share of new capacity in the first nine months of 2025.
The constraint has moved. It is no longer how much can be built, it is how much of what is built can be delivered, settled and paid for. The national utilization rate of 94.7% over the first three quarters of 2025 means 5.3% of available output was not delivered, of the order of 50 TWh.
Indicator
Value
Source
Installed photovoltaic capacity
1,126 GW at end September 2025
National Energy Administration, Q3 2025
Added in the first nine months of 2025
240 GW
National Energy Administration, Q3 2025
Utility-scale and distributed split
617 GW / 508 GW
National Energy Administration, Q3 2025
Solar generation, first three quarters 2025
916.3 TWh, up 44.1%
National Energy Administration, Q3 2025
National solar utilization rate
94.7%
National Energy Administration, Q3 2025
Wind and solar share of electricity generation
22% in 2025
Ember, May 2026
Year-on-year growth of installed capacity
+45.7%
National Energy Administration, Q3 2025
Key context
Two figures frame everything that follows. Distributed generation is now half the fleet, which makes the forecasting problem an aggregation problem. And 5.3% of available output did not reach the grid, which puts a price on every point of accuracy recovered.
A national obligation, provincial rules

Where the rules actually bite
Forecasting is mandatory for grid-connected renewable plants in China, and the technical requirements are set out in a body of national and industry standards. But the grid itself is organized by electrical connectivity, not by administrative boundary. State Grid Corporation of China covers twenty-six provinces and regions grouped into six regional grids. China Southern Power Grid covers five southern provinces.
Accuracy thresholds, assessment methods and deduction scales are set at that level, and revised there. Two plants of identical design, one in Qinghai and one in Jiangsu, do not face the same requirement, the same tolerance band or the same weather exemptions.
Standard
Scope
Status
Standard
Scope
Status
GB/T 19964
Connecting photovoltaic power stations to the power system
Revised 2024
GB/T 40607-2021
Dispatching-side forecasting system for wind or PV power
National standard
NB/T 32011-2013
Photovoltaic power forecasting systems
Industry standard
Key context
This is the structural point. A forecasting model calibrated on a national or continental average cannot answer a provincial requirement. Satellite-derived irradiance databases are built to be globally consistent, and that consistency is exactly what makes them miss the local signal a provincial threshold measures.
T/CES 139-2022 adds technical requirements for probabilistic forecasting of PV power, and T/CIET 1093-2025 addresses intelligent analysis and forecasting for distributed PV.

Where the constraint is hardest
The east coast. Shanghai, Jiangsu, Zhejiang and Guangdong concentrate demand, the tightest accuracy requirements and the most active spot markets. Plants there are smaller, closer to load, and exposed to coastal cloud regimes and typhoon seasons. The photograph above was taken at a plant in Zhejiang. That flat white sky, with no contrast and no visible cloud edge, is the condition in which a satellite-derived product has the least to work with, and it is common on the east coast for weeks at a time.
The northwest. Gansu, Qinghai, Ningxia and Xinjiang carry the largest desert-scale plants. High irradiance, long transmission distances to the load centers of the east, and dust and sand events that satellite products resolve poorly.
Region
Dominant constraint
Forecasting difficulty
Region
Dominant constraint
Forecasting difficulty
East China grid
Tightest accuracy thresholds, active spot markets
Coastal cloud, typhoon season
Northwest China grid
Desert-scale plants, long transmission distances
Dust and sand events
Distributed fleets, nationwide
508 GW, close to half the installed base
Aggregation across many small sites
Key context
Distributed generation deserves its own line. It now represents 508 GW and took 128 GW of the 240 GW added in the first nine months of 2025. Forecasting an aggregated distributed fleet is a different problem from forecasting a single desert plant, and the standards are following.

What the market already uses, and where it stops
China is not a market without forecasting. The China Meteorological Administration has been building dedicated systems for renewable energy since 2011, and specialised providers deliver production forecasts based on numerical weather prediction. Plant operators run their own systems, alone or with a supplier.
The limit is structural rather than commercial. Numerical weather prediction and satellite imagery describe the atmosphere at a resolution measured in kilometres and an update cycle measured in hours. The cloud that is about to cross a specific array sits below both. That is the gap CalibSun addresses with instruments installed on the plant itself.
Horizon
What the market uses today
Where the gap sits
Horizon
What the market uses today
Where the gap sits
Day-ahead
Numerical weather prediction
Adequate at plant level
Intraday
NWP and satellite imagery
Local microclimate not resolved
One minute to one hour
No effective coverage
Cloud motion below satellite resolution
Pre-construction resource
Satellite databases only
No on-site measurement to calibrate
Key context
The gap is not spread evenly across horizons. At day-ahead, every provider converges on the same weather models and the differences are small. Inside the hour, the difference is measured on the plant itself, and that is precisely where a dispatch center computes its accuracy percentage and where a deviation is settled. A forecast that looks good on a monthly average can still be charged in a single fifteen-minute block.
CalibSun in China: on-site data where the models stop
Global satellite models and numerical weather prediction describe the atmosphere at a resolution measured in kilometres. A provincial assessment measures the gap between a plant’s declared output and its actual output, at one site, under one microclimate. CalibSun closes that gap by measuring on the plant itself.
INSTANT, second-scale nowcasting for ramp events
Fisheye sky imagers installed on site see the cloud that satellite and pyranometers cannot resolve. INSTANT delivers irradiance and power forecasts from one minute ahead, the horizon where a ramp becomes a deviation and a deviation becomes a deduction. On isolated industrial grids it also allows thermal units to be committed before the drop rather than after it.
At the Loulo gold mine in Mali, INSTANT has run continuously since 2020. Photovoltaic capacity tripled to 72 MWp on a 65 MW heavy fuel oil and diesel grid, with no storage in phase one, and 15.6 Ml of fuel avoided.
NEXT, intraday and day-ahead accuracy where it is assessed
NEXT covers the horizons that provincial assessment actually measures, from intraday revision to D+1 and beyond. It is the product that speaks directly to a deviation settlement line and to the accuracy percentage a dispatch center computes at the end of the month. Forecasts are delivered as deterministic and probabilistic values, with calibrated quantiles from P5 to P95.
FUTURE, on-site measurement for bankable yield
Before construction, FUTURE replaces a satellite-based resource assessment with a calibrated one. An autonomous measurement cabin runs a one-year campaign on the site itself, and the calibrated data feeds the yield study. On a 100 MWp project, that campaign raised the measured resource by 1.5% against the reference satellite database and narrowed the gap between the P90 and P50 cases used by lenders.
Each plant has its own forecasting model, computed on AWS, and no data is shared between sites. Where regulation requires data to stay in the country, as in India or China, the database, the API and the forecasting compute are all hosted locally.
Need more information?
Get in touch!

- Questions
Frequently Asked Questions
What does a 94.7% utilization rate cost a plant operator?
It means 5.3% of available output was not delivered. Across the first three quarters of 2025 that is of the order of 50 TWh nationally. At plant level the causes are mixed, including grid constraint and dispatch decisions, but forecast error is one of the levers an operator controls directly.
Why does a satellite-based database underperform against a provincial accuracy requirement?
Satellite products are built for global consistency and validated against continental averages. A provincial assessment measures the gap between a plant’s declared output and its actual output, at that specific site, under that specific microclimate. Dust events in Xinjiang, coastal cloud in Zhejiang and altitude effects in Qinghai are exactly the signals a globally consistent product smooths away.
What changed for revenue when the single tariff was removed?
A plant selling at an administered price was largely insulated from its own forecast error. A plant selling into a provincial market is not. The deviation between declared and delivered energy is settled, so forecast quality now shows up in the revenue line rather than only in a compliance score.
Does INSTANT require permanent staff on site?
No. The imagers and the acquisition system are designed for unattended operation on industrial and remote sites. CalibSun has operated this configuration continuously since 2020 on an off-grid mining microgrid in Mali.
Regulatory and market information. Information on grid connection requirements, forecast accuracy assessment and deviation settlement is provided for general guidance only. In China these rules are set, applied and revised at provincial and grid-region level, and are not all published. Any threshold, range or mechanism described on this page is indicative and non-contractual, reflects general industry practice at the date of publication, and does not constitute legal, regulatory or financial advice. Market figures are drawn from public sources at the dates indicated and may have been revised since. Operators should verify the rules applicable to their own connection point with the competent grid company before relying on them. CalibSun accepts no liability for decisions taken on the basis of this page. Photograph of the agrivoltaics plant on the Guizhou plateau: Trina Solar. Basemap of the grid regions: Natural Earth, public domain.