





Solar forecasting in India
India crossed 164.6 GW of installed solar capacity on 31 July 2026, and added a record 15.3 GW in the first quarter of 2026 alone, 12.6 GW of it utility-scale. Gujarat and Rajasthan carried close to four fifths of those large-scale additions.
The constraint has moved with them. Around one third of the renewable capacity recently commissioned in India now faces grid curtailment, and under temporary general network access the curtailed share reaches 50 to 60% during solar generation hours. Curtailment is most pronounced in exactly the two states that are building fastest.
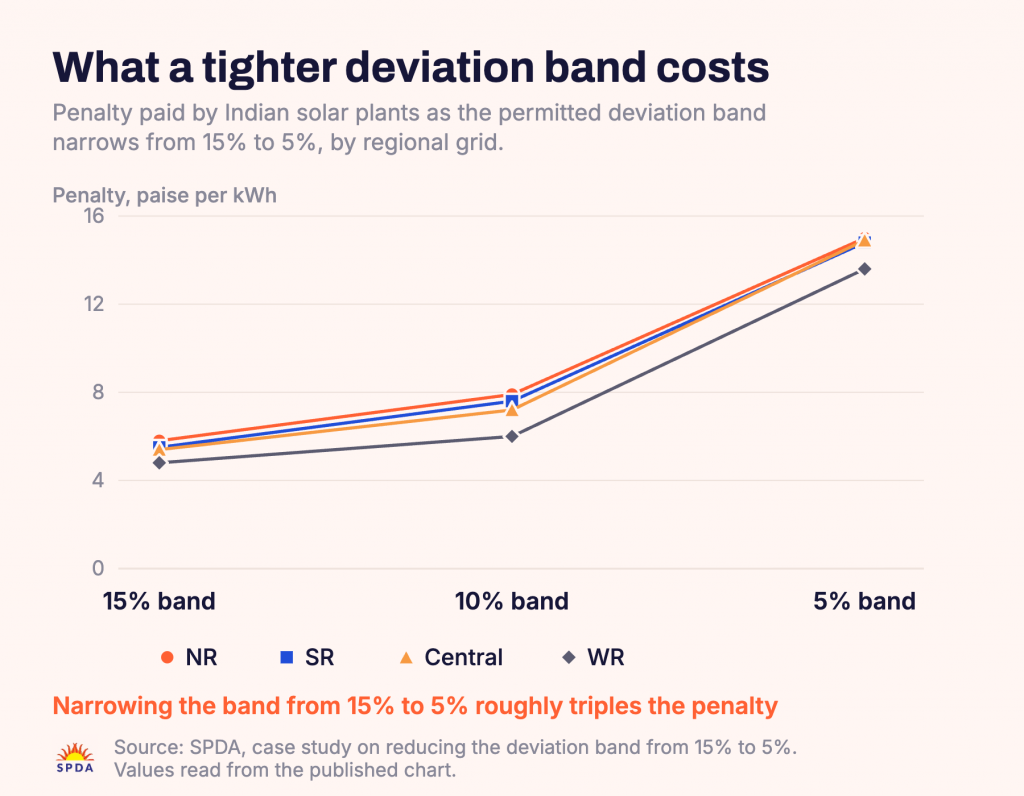
A second constraint arrived on 1 April 2026. The tolerance band for solar and wind-solar hybrid stations moved from plus or minus 10% to plus or minus 5%, so every 15-minute block that leaves the band is charged twice as easily as in 2025.
Together these two forces change what a schedule is worth. Output that cannot be evacuated has to be stored or shifted, and output that is declared wrongly is charged. Both decisions are made inside the hour.
Curtailment first, deviation charges second
Indian solar is scheduled in 15-minute blocks. The generator, or a Qualified Coordinating Agency acting for it, submits a day-ahead schedule to the load despatch centre and revises it during the day. Settlement compares injection to schedule, block by block, and charges the gap.
Curtailment sits upstream of that. Transmission build-out is running behind connection, with a pipeline of 107 GW awaiting interstate integration between the 2026 and 2031 financial years, and transmission projects still exposed to land acquisition and right of way delays. Curtailment erodes plant load factors by up to four percentage points in the states with the highest penetration.
The deviation charge is concentrated, not spread. On a 150 MW plant in the SRLDC area between October 2023 and March 2024, the blocks deviating by more than 30% were 2.35% of all blocks and carried 45.12% of the penalty paid. Forecasting in India is a tail problem.

Solar in India: the market in figures

India is the second-largest national market for renewables growth worldwide, with close to 345 GW of renewable capacity expected between 2025 and 2030, nearly 60% of it auction-driven utility-scale solar.
Among them, Khavda in Gujarat: the world’s largest PV plant, with 20 GW of solar capacity under development, where CalibSun provides solar production forecasting for Adani Green Energy.
The physical loss is not theoretical. On a 350 MW plant in Bikaner, clear-day generation averaged 2,843 MWh while the worst cloudy day delivered 310 MWh, a shortfall of 89%. The schedule for that day had been submitted the day before.
Indicator
Value
Source
Installed solar capacity
164,595 MW at 31 July 2026
MNRE, physical progress
Solar added in the first quarter of 2026
15.3 GW, a record, 12.6 GW utility-scale
SPDA, June 2026
Share taken by Gujarat and Rajasthan
Close to four fifths of large-scale additions
SPDA, June 2026
Renewable capacity facing curtailment
33% of 54.8 GW recently commissioned
ICRA, May 2026
Curtailment under temporary network access
50 to 60% during solar hours
ICRA, May 2026
Effect on plant load factor
Up to 4 percentage points in high-penetration states
Mordor Intelligence, 2026
Deviation tolerance band since 1 April 2026
Plus or minus 5%, against 10% before
CERC Order, Petition 9/SM/2025
Key context
Two constraints now act on the same 15-minute block. Curtailment decides how much of the available output can physically reach the grid, and the deviation band decides how much of what is declared has to be delivered. A plant that forecasts well manages both. A plant that does not pays twice.
CERC, the states, open access, and now storage
Four rulebooks on the same 15-minute block
CERC governs inter-state entities. It halved the solar tolerance band on 1 April 2026 and set a trajectory for the coefficient X, which decides whether deviation is measured against available capacity or against the submitted schedule. X holds at 100% until 31 March 2027, then falls to 90, 75, 55 and 30%, and reaches 0% on 1 April 2031. As X falls the denominator shrinks, and the same absolute error yields a larger deviation.
Each state commission sets its own bands and charges for intra-state sales. Gujarat and Rajasthan concentrate both the new capacity and the curtailment, and their rules are not the central ones. The band, the revision gate and the charge schedule therefore differ from one connection point to the next.
Short Term Open Access adds a third clock. A plant selling through STOA books capacity for days or weeks rather than for the life of a contract, declares a schedule against that booking, and carries the deviation on it. Open access volumes are growing as commercial and industrial consumers buy directly, which means more plants scheduling more often, on shorter notice.
Storage is becoming a rulebook of its own. Large-scale battery integration is the answer the sector is giving to curtailment, and it changes the forecasting problem rather than removing it. A battery has to be told what to charge and discharge, block by block, against a forecast of what the plant will produce and of what the grid will accept. Get the minute-scale profile wrong and the battery arbitrages the wrong way.
Rulebook
What it sets
Why it matters to a forecast
Rulebook
What it sets
Why it matters to a forecast
CERC, inter-state
Tolerance band and the trajectory of X
Band halved on 1 April 2026, denominator shrinks from 2027
State commissions
Intra-state bands, charges, revision gates
Gujarat and Rajasthan differ from the central rules
Short Term Open Access
Booked capacity and the schedule against it
More plants scheduling more often, on shorter notice
Key context
This is the structural point. Curtailment, the deviation band, open access and storage dispatch are four different mechanisms, set at four different levels, and they all resolve inside the same 15-minute block. A forecast that is good on a national monthly average answers none of them.
The monsoon decides when the money is lost
Around 75% of the deviation charges an Indian solar plant pays in a year are paid during the monsoon and fog months.
The exposure is not annual, it is seasonal, and inside those days it concentrates in a handful of 15-minute blocks. That is why an annual accuracy average tells an operator almost nothing about its bill.
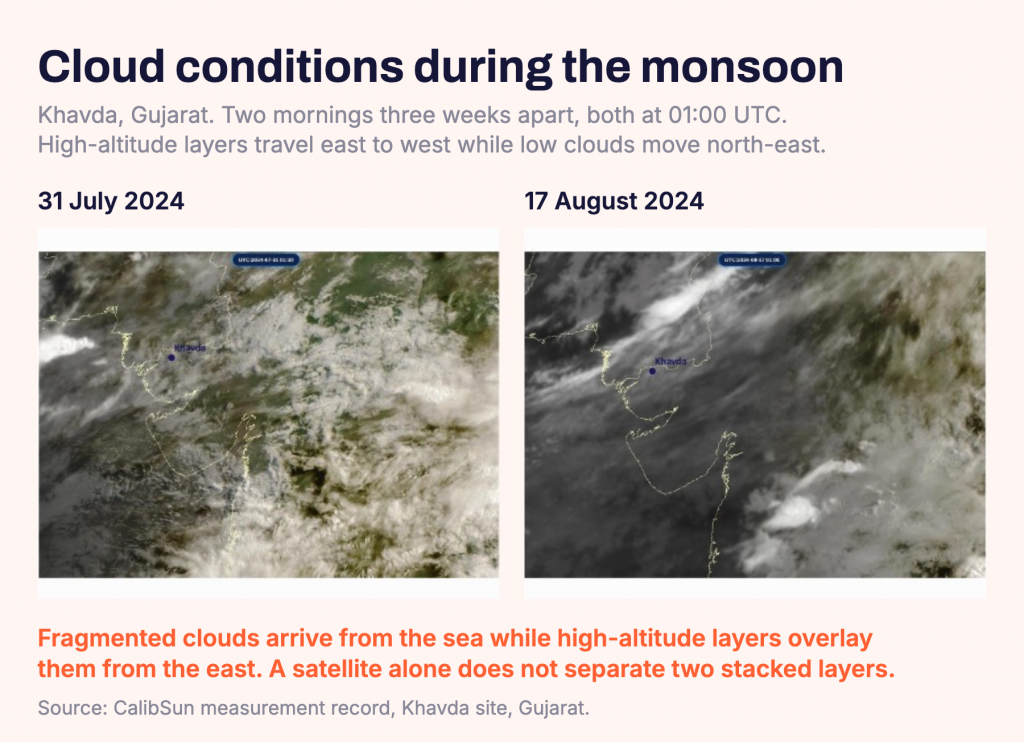
From June to September the south-west monsoon carries moisture from the Mascarene High across the Arabian Sea and the Bay of Bengal onto the subcontinent. For a plant in Gujarat or Rajasthan that is not one cloud field. It is two, stacked and moving in opposite directions.
CalibSun analyzed satellite imagery over the Kachchh region on 31 July 2024 and 17 August 2024, alongside ERA5 wind roses computed at 775, 500 and 300 hPa over 2020 to 2024. The pattern is stable. Fragmented low clouds arrive from the sea on a south-westerly flow and travel north-east. High-altitude layers overlay them, moving east to west.
A single cloud-motion vector from satellite imagery collapses that vertical structure into one plane. Geostationary imagery resolves at roughly 15 minutes and 3 km. Below the 15-minute block, that latency is comparable to the whole forecast horizon.
Region
Dominant constraint
Forecasting difficulty
Region
Dominant constraint
Forecasting difficulty
Kachchh and Banaskantha, Gujarat
Monsoon regime, two decoupled cloud layers
Cloud vector methods assume a single advected layer
Bikaner and Jodhpur, Rajasthan
Desert-scale plants, dust and winter fog
Fog days cut output by up to 89%
Tamil Nadu and Karnataka
Coastal convection, north-east monsoon
Cells form and dissolve inside one satellite frame
Key context
Indian cloud physics is not mid-latitude cloud physics. Peer-reviewed work on Indian forecasting regulation notes that convective clouds prevalent in India form and dissolve quickly, unlike the mostly advective cloud motion of mid-latitudes. Cloud vector methods assume advection. In a convective monsoon regime the assumption breaks.

Where the gap sits, and why a battery needs it
In a three-month blind benchmark run by the client across thirty PV sites, CalibSun ranked first of seven providers. On another European IPP’s own production data, NEXT reduced normalized mean absolute error against the incumbent satellite-based provider by 46% at 5 minutes, 33% at 15 minutes and 23% at 60 minutes. Beyond two hours every provider converges on the same weather models and the gap closes.
Those two horizons, 5 and 15 minutes, are exactly the ones a battery is dispatched on. A storage asset paired with a solar plant decides charge and discharge against the expected profile of the next few blocks, not against a daily total. It is the horizon where the curtailment can be absorbed instead of lost, and the horizon where the deviation is settled. The place where CalibSun is measurably strongest is the place where storage makes its money.
Horizon
What the market uses today
Where the gap sits
Horizon
What the market uses today
Where the gap sits
Day-ahead
Numerical weather prediction
Adequate at plant level
Intraday, one to four hours
NWP and satellite imagery
Local microclimate not resolved
One minute to one hour
No effective coverage
Cloud motion below satellite resolution
Pre-construction resource
Satellite databases only
No on-site measurement to calibrate
Key context
The revision gate sits close to two hours centrally and close to one hour in Gujarat. That is exactly the window where the measured gap is widest, and it is the window a satellite-based product cannot reach.
CalibSun in India: on-site data where the models stop
Global satellite models and numerical weather prediction describe the atmosphere in kilometers and in hours. The cloud about to cross a specific array sits below both. CalibSun measures it from the ground.
INSTANT, sub-30-minute nowcasting for monsoon ramps and storage dispatch
INSTANT deploys hemispherical sky imagers and pyranometers on the plant, updates every minute, and anticipates irradiance drops at second to minute resolution. An inner camera triangle covers clouds within 5 km, an outer triangle 5 to 30 km. Because it measures cloud height by stereoscopy rather than assuming it, it separates the two monsoon layers instead of averaging them.
That is the signal a co-located battery needs. Knowing a ramp is coming two minutes before it arrives is what allows the storage asset to charge the excess instead of the plant losing it to curtailment.
At the Loulo gold mine in Mali, INSTANT has run continuously and unattended since 2020, on a photovoltaic fleet tripled to 72 MWp over a 65 MW heavy fuel oil and diesel grid.
NEXT, intraday and day-ahead accuracy where deviation is settled
NEXT assimilates plant measurements from your SCADA, satellite imagery and a weather model ensemble, and returns quantile distributions per 15-minute block rather than a single trace, timed to the revision gates. It is software only, delivered by API, with no hardware on site. In an independent 30-site benchmark it ranked first of seven providers.
FUTURE, on-site measurement before the plant exists
FUTURE runs twelve months of on-site measurement at 5-minute resolution to correct satellite bias at source, taking irradiance uncertainty from around 5% to 0.5%. It produces a bankable typical meteorological year on ten years of corrected satellite history, with P50 and P90 structured for lenders, plus a 1-minute series for storage sizing.
Each plant has its own forecasting model, computed on AWS, and no data is shared between sites. Where regulation requires data to stay in the country, as in India or China, the database, the API and the forecasting compute are all hosted locally.
Need more information?
Get in touch!

- Questions
Frequently Asked Questions
How much Indian solar capacity is exposed to curtailment?
Around one third of the renewable capacity recently commissioned faces grid curtailment, 33% of 54.8 GW according to ICRA as of May 2026. Under temporary general network access the curtailed share reaches 50 to 60% during solar generation hours. It is most pronounced in Rajasthan and Gujarat, the two states building fastest.
What deviation band applies to an Indian solar plant in 2026?
Under the central framework the first volume limit is a deviation up to 5% of available capacity from 1 April 2026, against 10% until 31 March 2026, and the second runs up to 10%. Intra-state sales follow the applicable state regulation, which may differ. The coefficient X begins to fall in 2027, which tightens the same rule further.
Why does satellite forecasting underperform during the monsoon?
Geostationary imagery resolves at roughly 15 minutes and 3 km, and cloud vector methods assume clouds are advected rather than formed and dissolved in place. Monsoon conditions stack two layers moving in different directions, and convective cells appear and disappear inside a single frame interval.
What does a battery change for forecasting?
It moves the problem rather than removing it. A battery has to be told what to charge and discharge for each 15-minute block, against a forecast of plant output and of what the grid will accept. That decision is made at the 5 and 15 minute horizons, which is where the measured accuracy gap is widest.
Regulatory and market information. The regulatory information on this page is indicative and provided for general guidance only. It is not contractual and is not legal, regulatory or financial advice. Forecasting, scheduling and deviation settlement rules in India are set at central level by the Central Electricity Regulatory Commission and at state level by each State Electricity Regulatory Commission, and are amended frequently, including through orders and pending litigation. The rules applicable to a given plant depend on its connectivity, its offtake arrangement and its state. Market figures are drawn from public sources at the dates indicated and may have been revised since: installed capacity from MNRE at 31 July 2026, quarterly additions from SPDA in June 2026, curtailment from ICRA as of May 2026 as reported by pv magazine on 8 July 2026. The share of deviation charges attributed to the monsoon and fog months is an order of magnitude gathered from Indian operators and from observations on the fleets CalibSun follows. It is not drawn from a published study and will vary by plant, by state and by year. Please verify the applicable provisions with the competent SLDC, RLDC or QCA before taking any commercial or operational decision. CalibSun accepts no liability for any use made of this information. Penalty against error band chart: Sustainable Projects Developers Association. Photograph of the solar plant: Tata Power. Satellite imagery over the Kachchh region: analysis by CalibSun.