




- Calibsun | NEXT | Demo
Next Dashboard
One platform to analyse your forecasts

Live Intraday Tracking & System Health
Ensure optimal operations with our real-time system monitoring. This component provides an immediate overview of your data pipeline health, displaying the exact status of data feeds, recent site measurements, and the latest forecast computations. Paired with our live probabilistic forecasting chart, operators can visualize the expected deterministic yield alongside comprehensive confidence intervals, ranging from P05 to P95 for the current day. This visibility allows energy managers to instantly assess the current operational state and anticipate potential variations in solar generation due to incoming weather volatility, ensuring highly reliable intra-day grid balancing and dispatch decisions.
Precise Day-Ahead Scheduling
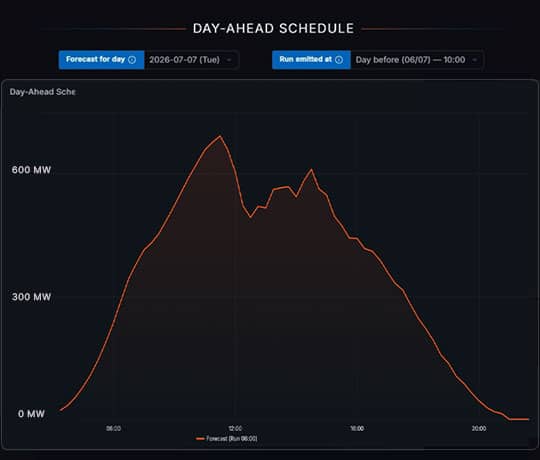
Anticipate tomorrow’s energy production with precision using our dedicated Day-Ahead Schedule view. Designed for asset managers, grid operators, and energy planners, this tool isolates the exact forecasting runs required for proactive daily management. By visualizing the predicted solar yield for the upcoming day, users can confidently plan their energy commitments, optimize battery storage scheduling, and coordinate maintenance windows. The interface clearly indicates the specific model run time, ensuring full transparency regarding the data version being utilized. This targeted visibility helps ensure grid stability, minimizes operational friction, and maximizes the overall efficiency of your renewable energy assets.
Continuous Error Metrics Tracking
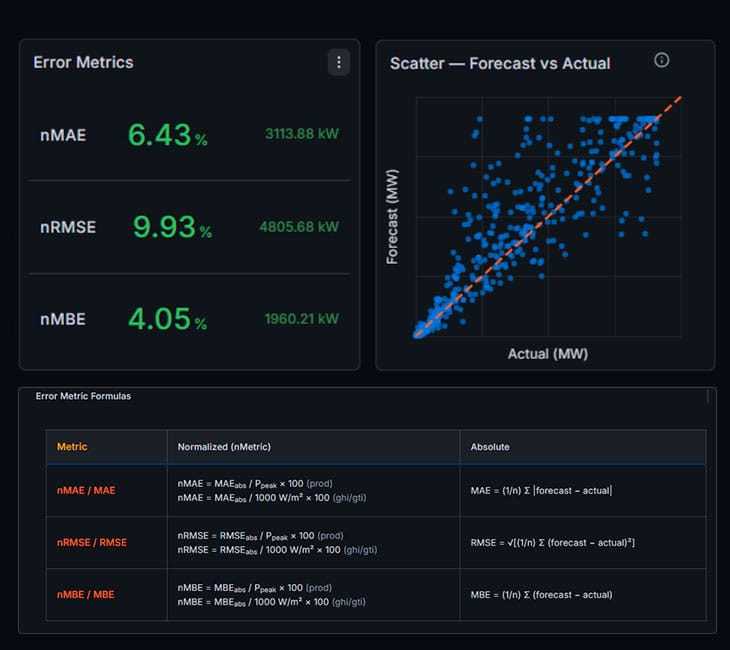
Maintain complete transparency regarding model performance with our automated error metrics tracking. This module continuously calculates key performance indicators, including Normalized Mean Absolute Error, Normalized Root Mean Square Error, and Mean Bias Error. Displayed in both percentage and absolute terms, these figures offer a clear, objective assessment of forecasting accuracy over your selected historical timeframe. For asset owners and portfolio managers, this precise tracking is essential for bankable reporting, ongoing model validation, and ensuring that your forecasting services consistently meet strict contractual performance obligations.
Historical Analysis
Evaluate past performance effectively with our robust historical analysis tools. The time-series chart directly overlays forecasts against site production. Crucially, operators can toggle the baseline between real measured data and our in-house calculated nominal production. This nominal view estimates the true solar potential, completely removing the effects of grid curtailments or plant outages. As you switch sources, the scatter plot and all corresponding error metrics update dynamically. These deep retrospective insights empower technical teams to accurately audit operations, isolate performance issues, and continually refine their future energy strategies.

Need more information ?
Get in touch !

- Questions
Frequently asked questions
What data sources feed the dashboard?
The dashboard aggregates live data feeds, on-site measurements, and forecast model outputs into a single, continuously updated platform, giving you full visibility across your solar assets.
How often is the forecast updated?
Intraday forecasts and system status are refreshed in real time, while day-ahead forecasts are generated on a fixed daily schedule, with each run clearly timestamped for full transparency.
What is the difference between measured and nominal production?
Measured production reflects actual site output, while nominal production is our in-house calculated estimate of true solar potential, excluding the effects of curtailments or outages.
Which error metrics are available?
The dashboard tracks Normalized Mean Absolute Error (NMAE), Normalized Root Mean Square Error (NRMSE), and Mean Bias Error (MBE), shown in both percentage and absolute values.
Can I customize the KPIs displayed?
Yes, the platform supports custom KPIs tailored to your operational needs, in addition to the standard error and performance metrics.
How far back does the historical data go?
Historical performance and error metrics can be reviewed over any selected timeframe, enabling in-depth audits and long-term model validation.