




Solar Energy
in Latin America (LATAM)
Solar energy in Latin America
Latin America is one of the most dynamic regions for solar energy development globally. From Brazil’s Northeast to Chile’s Atacama Desert and Mexico’s arid plateaus, the continent holds some of the highest solar irradiance values on Earth (and governments across the region have set ambitious renewable energy targets to capitalize on this resource). The energy transition in Latin America is accelerating, driven by falling cost of solar technology, supportive policies, and rising electricity demand.
For Independent Power Producers, aggregators, and energy traders active in the solar PV market, the operational stakes have shifted. Expanding solar capacity remains a priority, but the critical challenge is now managing installed generation capacity in deregulated electricity markets. In environments where spot price volatility, grid congestion, and curtailment directly affect revenues, accurate solar forecasting has become a core operational requirement.
Latin America Solar Market: Size, Growth, and Renewable Energy Targets
The Latin America solar panel market has grown from a marginal share of the regional electricity mix to one of the fastest-expanding segments of the global solar PV market. Brazil, Chile, and Mexico account for the largest share of new solar PV capacity additions across the region.
Across Latin America, governments are implementing policies designed to reduce dependence on fossil fuels, improve energy security, and meet climate change commitments. These policies and incentives (including auctions, net metering frameworks, and tax exemptions for solar technology) have made solar energy more accessible to both utility-scale developers and distributed generation customers.
The outlook for Latin American solar energy remains strongly positive. The IEA projects that solar and wind will together represent the dominant source of new electricity generation capacity in the region through 2030. Energy storage solutions (including battery systems) are increasingly being integrated into solar power plant projects to manage grid stability and extend the value of photovoltaic power generation.
Solar Energy in Brazil: The Deregulated Market, ONS, and PLD Exposure

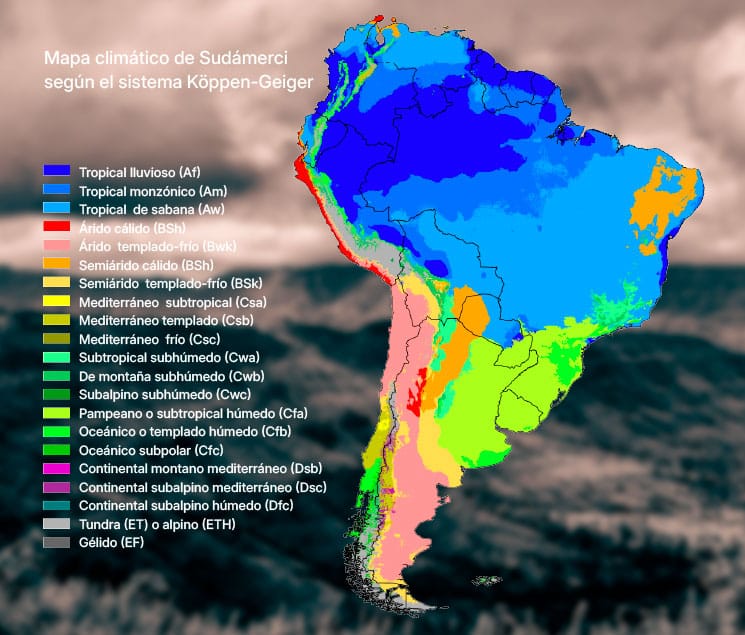
Brazil’s solar energy market is the largest in Latin America by total installed solar PV capacity. As of 2025/2026, it encompasses approximately 20.1 GW of centralized utility-scale installations and approximately 36 GW of distributed generation capacity. ANEEL data confirms that centralized solar PV will represent the single largest source of new installed generation capacity in Brazil in 2026 (4,560 MW projected, ahead of both thermal and wind additions). As of April 2026, renewable sources account for 84.81% of Brazil’s monitored power capacity, with solar PV contributing approximately 15.7% of total electricity generation.
At the utility-scale level, large ground-mounted solar power plants are concentrated in the high-irradiance states of Brazil’s Northeast. Bahia, Piauí, and Pernambuco benefit from GHI values consistently above 5.5 kWh/m²/day (World Bank Global Solar Atlas 2.0), placing them among the most productive solar regions in South America. The approval of Brazil’s first battery energy storage system co-located with a solar power plant (April 2026, ANEEL) signals a structural shift toward hybrid solar-plus-storage assets, with direct implications for generation scheduling and grid balancing obligations.
Operating in the deregulated electricity market (Ambiente de Contratação Livre, ACL) requires precise daily generation scheduling. Discrepancies between declared and actual energy production trigger direct exposure to the PLD (the settlement price for differences) calculated and applied by the CCEE.
The forecasting challenge in Brazil is not uniform. While the Northeast enjoys relatively stable solar radiation conditions, the Southeast and South are subject to more significant cloud cover variability and convective weather patterns. Satellite-based solar PV energy estimates carry systematic biases in these regions that can only be corrected through integration of on-site measurement data.
Indicator
Value
Source
Solar PV share of centralized installed capacity
9.3% (~20.1 GW centralized)
ANEEL SIGA, January 2026
Distributed solar PV installed capacity
~36 GW
ABSOLAR / ANEEL, 2025
Solar PV share of total electricity generation
~15.7%
ONS, Q1 2026 (preliminary)
New solar PV added Q1 2026
1,1 GW
ANEEL, April 2026
Projected new centralized solar PV in 2026
4,5 GW
ANEEL, January 2026
Average solar irradiance (Northeast)
5.5–6.5 kWh/m²/day GHI
World Bank Global Solar Atlas 2.0 / Solargis, 2024
Government solar PV target by 2032
~78 GW (centralized + distributed)
EPE PDE 2032, 2023
Key context
Brazil’s electricity matrix is undergoing accelerating transformation. In 2026, ANEEL projects 9,142 MW of new installed capacity (a 23.4% increase over 2025), with centralized solar PV representing the single largest contribution at 4,560 MW (ahead of thermal at 2,770 MW and wind at 1,430 MW). Renewable sources account for 84.81% of Brazil’s monitored power capacity as of April 2026. Solar PV contributes approximately 15.7% of total electricity generation (ONS, Q1 2026). Distributed solar capacity has reached approximately 36 GW, placing Brazil among the top four distributed solar markets globally. The country’s first battery energy storage system co-located with a solar power plant was approved by ANEEL in April 2026 (Sol de Brotas 7, Bahia, 1 MW / 5 MWh), marking a structural step toward integrating storage with variable solar generation.
Chile and Peru: Grid Constraints, Curtailment, and Microclimate Complexity

The Atacama Desert: Solar Capacity, Grid Saturation, and Vertimiento
Chile’s solar capacity growth has been driven by the exceptional solar irradiance of the Atacama Desert. With GHI values reaching up to 9–10 kWh/m²/day in certain northern zones, ground-mounted solar power plants in this region achieve capacity factors well above the global average for photovoltaic power generation. Solar PV now accounts for 23.4% of Chile’s electricity generation and 28% of total installed capacity (CNE, 2024), reflecting a market that has already passed the early growth phase and entered operational maturity.
The structural challenge is the North-South transmission grid. Electricity generation in Chile’s northern solar belt consistently exceeds transmission capacity toward the central and southern demand centers. The CEN manages this imbalance through curtailment (vertimiento), which reached up to 22% of potential solar generation in northern grid zones in 2024 (CEN, Informe de Vertimientos 2024). For IPPs and aggregators, curtailed energy represents direct revenue loss. Sub-hourly solar forecasting provides the lead time necessary to adjust market positions before curtailment events occur, reducing their financial impact.
Indicator
Value
Source
Total installed solar PV capacity
12.8 GW
CNE / CEN, December 2024
Solar share of electricity generation
23.4%
CNE, Generación Eléctrica por Tecnología 2024
Curtailment rate (northern grid zones, 2024)
Up to 22% of potential generation
CEN, Informe de Vertimientos 2024
Renewable energy target by 2030
60% of electricity generation
Ministerio de Energía Chile, 2023
Key context
Chile hosts some of the highest solar radiation levels recorded globally. The Atacama Desert enables ground-mounted solar power plants with capacity factors significantly above the global average for photovoltaic power generation. Solar PV now represents 23.4% of Chile’s electricity generation (2024) and 28% of total installed capacity. However, structural transmission constraints between northern generation zones and southern demand centers create systemic curtailment risk (vertimiento), with up to 22% of potential solar generation curtailed in northern grid zones in 2024. This makes sub-hourly solar forecasting a critical tool for IPPs and aggregators managing market positions.

Peru: Andean Microclimates and the Limits of Satellite Data
Peru’s electricity market is expanding in response to growing electricity demand, with the mining sector as the primary driver. Solar PV capacity in the SEIN has grown to approximately 1.1 GW (COES, December 2024), with solar PV systems increasingly deployed to serve both grid-connected and off-grid mining operations. Total renewable generation covers approximately 65% of electricity production, with large hydro remaining dominant at 55%.
On the Pacific coast, the camanchaca (a dense coastal fog) significantly reduces GHI at low altitudes, particularly during the austral winter months. Inland, at Andean elevations, cloud cover patterns are highly localized and rapid. Standard NWP models and global solar irradiance datasets are not calibrated for these conditions. The result is systematic overestimation of solar energy production in feasibility studies based on satellite data alone (leading to bankability risk and operational penalties under COES dispatch rules).
Indicator
Value
Source
Total installed solar PV capacity (SEIN)
~1.1 GW
COES / OSINERGMIN, December 2024
Total renewable share of electricity generation
~65% (hydro ~55%)
COES, Balance de Generación 2024
Solar irradiance (Andean altiplano)
5.0–6.5 kWh/m²/day GHI
World Bank Global Solar Atlas 2.0
Primary electricity demand driver
Mining industry
COES
Key context
Peru’s solar PV market has grown significantly, reaching approximately 1.1 GW of installed capacity in the SEIN as of December 2024. Rising electricity demand (driven primarily by the mining sector) continues to create new opportunities for solar power plant development. Total renewables account for approximately 65% of electricity generation, with hydro representing the dominant share at 55%. Complex microclimates (coastal camanchaca fog and high-altitude Andean cloud dynamics) make global satellite-based solar irradiance estimates systematically unreliable. Local ground-level measurements are essential for bankable solar resource assessments.
Mexico
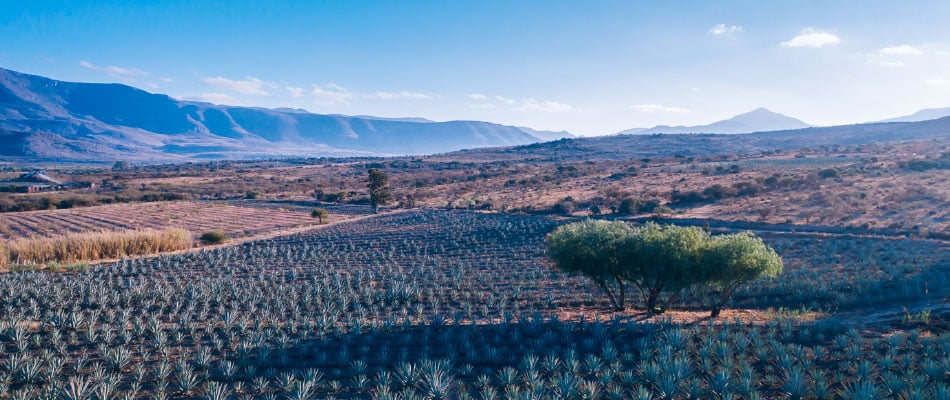
Mexico holds significant solar energy potential, particularly in its northern arid regions. Total installed solar PV capacity reached approximately 14.6 GW in 2024, with solar contributing 11.8% of national electricity generation. The Sheinbaum administration (2024) has announced a commitment to 40% clean energy in Mexico’s electricity mix by 2030 under the Plan México Eléctrico, with solar and wind as primary contributors. Grid access constraints and CENACE dispatch rules create operational complexity for IPPs managing solar power capacity in the deregulated segments of the market.
Indicator
Value
Source
Total installed solar PV capacity
~14.6 GW
SENER, Prospectiva del Sector Eléctrico 2024–2038
Solar share of electricity generation
~11.8%
SENER, Balance Nacional de Energía 2024
Average solar irradiance
5.0–6.5 kWh/m²/day GHI
NREL / World Bank Global Solar Atlas 2.0
Renewable energy target by 2030
40% clean energy in electricity mix
SENER / Plan México Eléctrico, 2025
Key solar regions
Sonora, Chihuahua, Baja California
SENER
Key context
Lorem ipsum dolor sit amet, consectetur adipiscing elit. Ut et massa mi. Aliquam in hendrerit urna. Pellentesque sit amet sapien fringilla, mattis ligula consectetur, ultrices mauris. Maecenas vitae mattis tellus. Nullam quis imperdiet augue. Vestibulum auctor ornare leo, non suscipit magna interdum eu. Curabitur pellentesque nibh nibh, at maximus ante fermentum sit amet. Pellentesque commodo lacus at sodales sodales. Quisque sagittis orci ut diam condimentum, vel euismod erat placerat. In iaculis arcu eros, eget tempus.
CalibSun: On-Site Data Integration for Latin American Solar Markets
Global satellite models and numerical weather prediction (NWP) systems are designed for broad geographic coverage. They perform adequately in homogeneous atmospheric conditions but lose accuracy in the complex, localized climates characteristic of Latin American solar markets. The gap between satellite-derived solar irradiance estimates and actual ground-level conditions is not a marginal rounding error (it is a systematic bias that affects daily generation scheduling, PPA compliance, and investment-grade energy yield assessments).
CalibSun addresses this gap by combining on-site measurements with NWP and satellite inputs. On-site sensors correct satellite biases in real time. The result is a solar forecast that reflects actual plant-level conditions rather than a regional model approximation. This approach is directly applicable across the three distinct forecasting horizons that matter to solar energy operators in Latin America.
INSTANT (Nowcasting for Real-Time Grid and Curtailment Management)
At the sub-hourly level, CalibSun deploys sky imagers on-site at solar power plants. These fisheye-lens cameras provide a three-dimensional view of cloud dynamics directly above the installation, combined with data from existing on-site sensors. The resulting nowcasts (covering 1 minute up to 30 minutes ahead) allow Energy Management Systems to anticipate drops in photovoltaic power generation before they occur.
For operators managing curtailment exposure in Chile or maintaining stable grid injection in Brazil’s deregulated market, this granularity enables proactive output adjustments and reduces the financial consequences of unplanned generation shortfalls.
NEXT (Intraday and D+1 Solar Forecasting to Reduce Imbalance Costs)
For daily generation schedule submissions and intraday electricity market operations, CalibSun’s NEXT solution integrates on-site inverter data with climate model outputs. The local calibration layer corrects for the systematic biases that affect purely satellite-based solar forecasts (particularly in regions with variable cloud cover or complex topography).
This directly reduces the gap between declared and delivered energy volumes, limiting PLD exposure in Brazil and equivalent settlement penalties in Chile and Peru. It is operationally relevant for any solar power plant or portfolio operating under dispatch obligations in a deregulated electricity market.
FUTURE (Solar Resource Assessment for Bankable Project Development)
During the development phase, solar energy projects across Latin America typically rely on satellite-derived solar irradiance data for energy yield assessments and PPA structuring. In regions with complex microclimates (coastal Peru, southern Brazil, high-altitude Andean sites) these datasets carry biases that affect the reliability of P50 production estimates and the probabilistic envelope (P10 to P90) used by lenders and investors.
CalibSun installs autonomous weather stations before construction begins, collecting ground-level GHI and GTI data over a representative measurement period. This local dataset is used to calibrate satellite inputs, producing a corrected energy yield assessment that reflects actual site conditions. The result supports bankable solar assessments (reducing investor uncertainty and providing a defensible basis for PPA negotiation and project financing).
Need more information ?
Get in touch !

- Questions
Frequently Asked Questions
How does on-site data integration reduce financial penalties in Brazil's solar energy market?
Satellite-based solar irradiance models carry systematic biases relative to ground-level conditions. Integrating data from on-site inverters and sensors into the forecasting pipeline reduces the discrepancy between declared and actual electricity generation. This directly limits exposure to the PLD (the settlement mechanism applied by the CCEE to imbalances between contracted and delivered energy volumes in Brazil’s deregulated market).
How can solar curtailment risk be anticipated in Chile?
CalibSun’s INSTANT nowcasting solution uses sky imagers installed on-site to generate minute-by-minute cloud cover and solar irradiance forecasts. These allow EMS operators to anticipate generation drops and adjust market positions before curtailment is imposed by the CEN (reducing the revenue impact of vertimiento on solar power plant portfolios).
Why do global satellite databases underperform in Peru and parts of Brazil?
Global solar irradiance datasets are calibrated for broad geographic regions. They do not capture localized phenomena such as the camanchaca coastal fog in Peru, high-altitude Andean cloud dynamics, or convective variability in Brazil’s Southeast. These conditions create systematic gaps between satellite estimates and actual GHI at the plant level. On-site measurement campaigns provide the ground truth necessary to correct these biases in both forecasting and solar resource assessment workflows.
Does CalibSun's system require ongoing on-site operational management?
Beyond the initial installation of sky imager hardware, the system retrieves data automatically from existing plant sensors. No continuous manual intervention is required from plant operations teams during normal operation.