




Solar forecasts are judged on averages. Markets do not work on averages. Deviation is settled block by block, and in most markets the block is fifteen minutes. What decides the size of an imbalance penalty is not how good a forecast was last month, but how wrong it was in the next few blocks. That is why the only benchmark that matters to an operator is one that measures accuracy horizon by horizon, on real plants, against real alternatives.
The benchmark
A European independent power producer runs a continuous, live benchmark of solar forecasting providers across its own portfolio: 30 utility-scale plants, seven providers evaluated blind on identical data over a three-month period, four error metrics. CalibSun is one of the seven. The other six are anonymised here, as is the operator. The full report is available on request under NDA.
We did not design this benchmark, we did not host it, and we could not see the other providers’ submissions. We simply received the same measurement files as everyone else.
Result one: first of seven on intraday accuracy
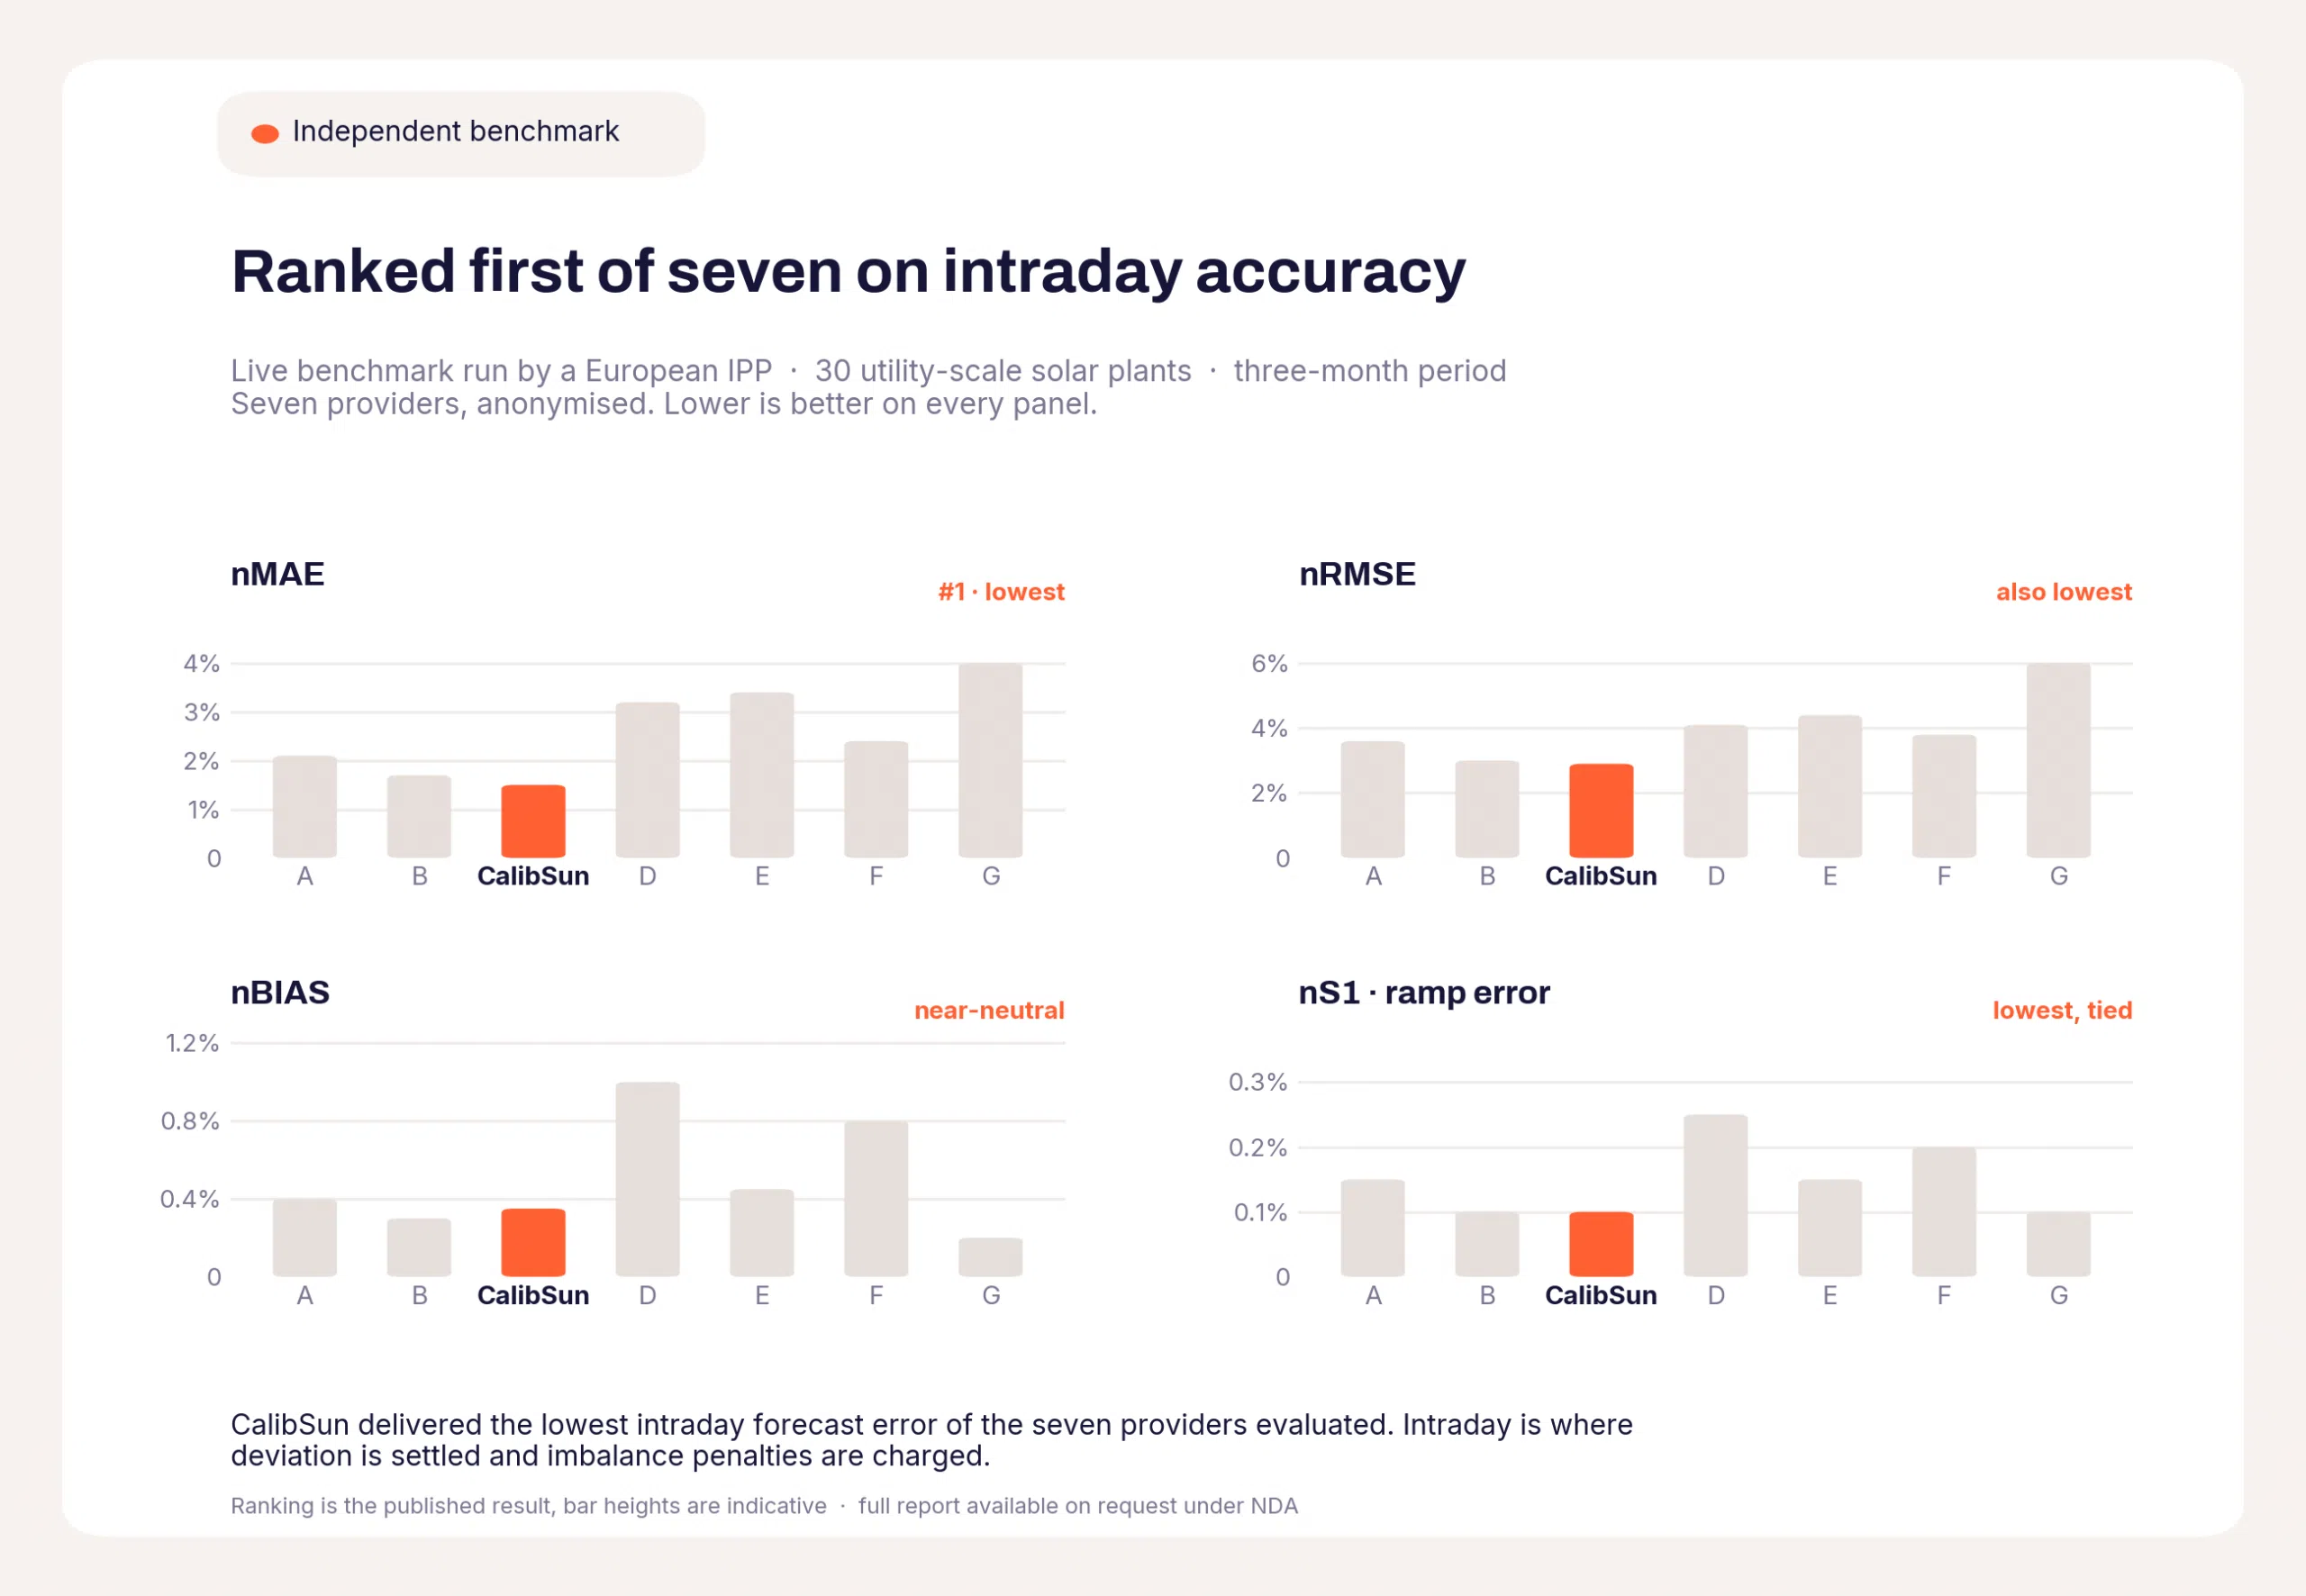
On intraday forecast error, measured as normalised mean absolute error, CalibSun ranked first of the seven providers. The result holds on nRMSE. Bias is close to neutral, which matters for traders: a biased forecast is a position you did not choose to take.
Result two: the advantage sits where the money is

On a second client portfolio, read against the incumbent provider horizon by horizon, the picture is even clearer. CalibSun cuts forecast error by 46% at 5 minutes and 33% at 15 minutes, the settlement horizon of most markets. The advantage stays above 20% across the first hour, then narrows, and disappears at 8 hours.
That last point deserves to be said plainly: at day-ahead horizons, every serious provider converges on the same weather models, and no one should claim a large edge there. The first hour is different, because it is won or lost on local, real-time observation rather than on models everyone shares. It is also, not coincidentally, where intraday positions are corrected and deviation is settled.
What it changes in operation
On a live multi-GW deployment, NEXT cut imbalance penalties by 18% and released over $500k of cash per GW annually. For sites that need foresight inside 30 minutes, INSTANT adds a further 20% of accuracy at nowcasting horizons on top of NEXT, using a network of sky imagers, from seven cameras per site.
Verify it
Benchmark results are only worth the scrutiny they can survive. The full report, with provider-level results and the complete methodology, is available on request under NDA. If you operate solar assets and want to know what these numbers would mean on your portfolio, contact us.