




The duck curve is the shape net load takes in any market with a lot of solar on the grid: a steep dip in the middle of the day as solar generation floods the system, then a sharp climb in the evening when the sun sets just as demand peaks. It was first analysed by NREL in 2008 and made famous by the chart California’s grid operator CAISO published in 2013. It has deepened every year since. By 2026 several grids no longer describe a duck at all, but a canyon.
The response is well understood: put a battery energy storage system, a BESS, next to the solar. What is less understood, and what decides whether that BESS earns anything, is when it charges and when it discharges. That is a solar forecasting question before it is a hardware question, and it is the argument of this article: the value of a battery is set by the quality of the forecast that drives it. The better the forecast, the more of the duck curve the same battery can actually flatten.
Key takeaways of the article
- The duck curve has deepened into a canyon curve: high solar penetration creates a deep midday dip followed by a sharp evening ramp, and the pattern is worsening in California, Germany, India and Australia.
- A BESS paired with solar is the structural answer, charging on the midday surplus and discharging into the evening peak to flatten the curve.
- Dispatch precision matters more than installed capacity: across major markets, curtailment losses kept rising even as storage deployment grew.
- Solar forecasting sets the dispatch, with day-ahead forecasts fixing the plan and short-term on-site forecasts correcting it while the day happens.
Duck curve at a glance: net load swings of up to 24 GW within 8 hours in California in spring 2025, battery storage attached to nearly 40% of new solar interconnection applications in 2024-2025, up from 13% in 2023, 457 hours of negative electricity prices in Germany in 2024, global battery storage additions up 53% in 2024.
What Is the Duck Curve?
A graphical representation of solar generation through the day
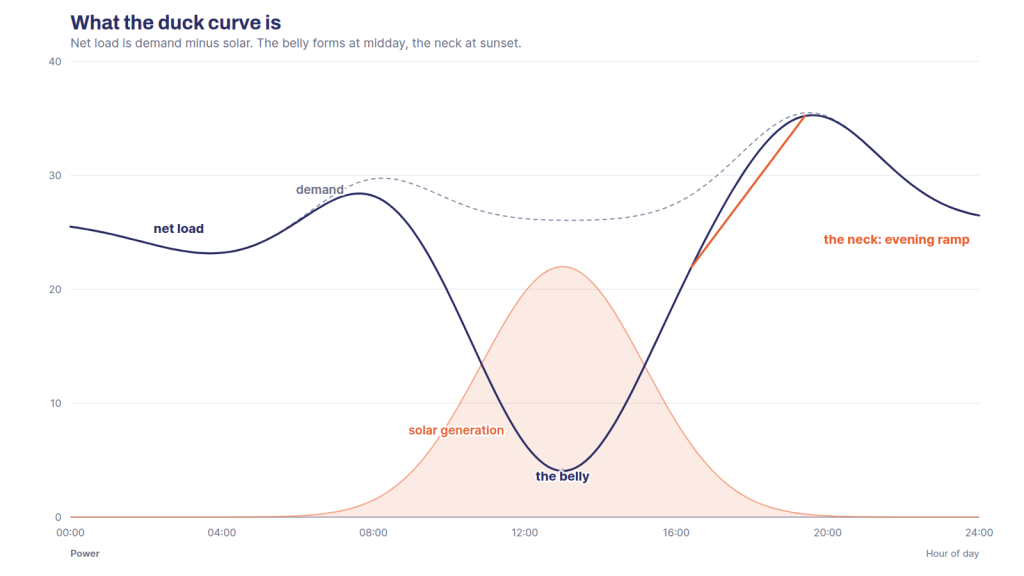
Net load is total electricity demand minus the generation that cannot be dispatched, essentially wind and solar. Plotted over twenty-four hours in a high-solar grid, it draws the duck. Through the morning, commercial and utility-scale solar ramps up and net load falls sharply, forming the flat belly. At midday, in the deepest markets, solar can exceed demand outright. When output collapses at sunset while evening demand rises, net load climbs steeply and forms the neck, the evening ramp.
Grid operators have to cover that ramp with whatever can be dispatched, gas, nuclear, thermal, hydro or storage, inside a narrow and fast-moving window. The deeper the daily swing, the harder that is. Overgeneration at midday forces solar curtailment or drives prices negative. The evening ramp strains conventional plants, raises costs and increases the risk of a shortfall. That is why utilities treat the duck curve as a planning constraint rather than a curiosity.
From duck to canyon: what 2025 and 2026 data shows
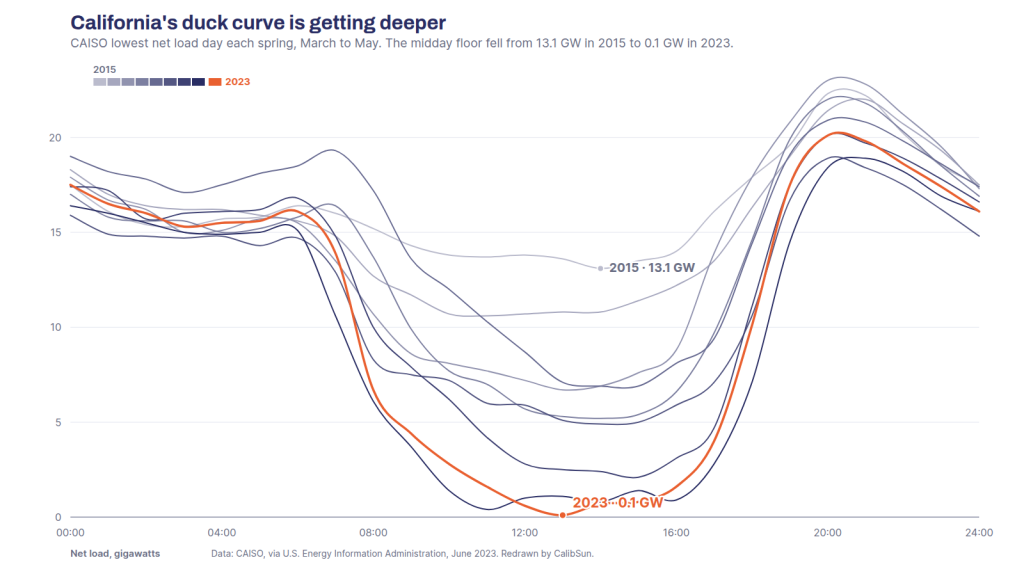
California illustrates the shift. Net load swings of up to 24 GW within eight hours were recorded in spring 2025, with midday valleys falling to around 8 GW. FactSet’s analysis of CAISO data shows the evening ramp reduced by nearly 50% by battery activity, and storage attached to nearly 40% of new solar interconnection applications in 2024 and 2025, up from 13% in 2023. CAISO’s battery fleet reached 11.6 GW by early 2025.
The pattern is not Californian. Germany recorded 457 hours of negative electricity prices in 2024. India curtailed an estimated 2.3 TWh of solar between May and December 2025. Globally, battery storage additions grew 53% in 2024 to 205 GWh installed.
Europe shows the same mechanism, and it has now been measured. KfW Research examined a panel of European bidding zones between 2023 and 2025 and estimated what one additional megawatt of grid-scale battery per gigawatt of peak load does to day-ahead hourly prices. Midday prices rise by 0.14 EUR/MWh. Evening prices fall by 0.38 EUR/MWh. The gap between the two therefore narrows by 0.52 EUR/MWh. Applied to the growth of the German grid-scale fleet over those three years, that amounts to a daily spread roughly 17 to 19% smaller than it would otherwise have been, and hourly prices about 16% less dispersed across the day. Behind-the-meter storage, charged for self-consumption and rarely offered day-ahead, shows no such effect at all.
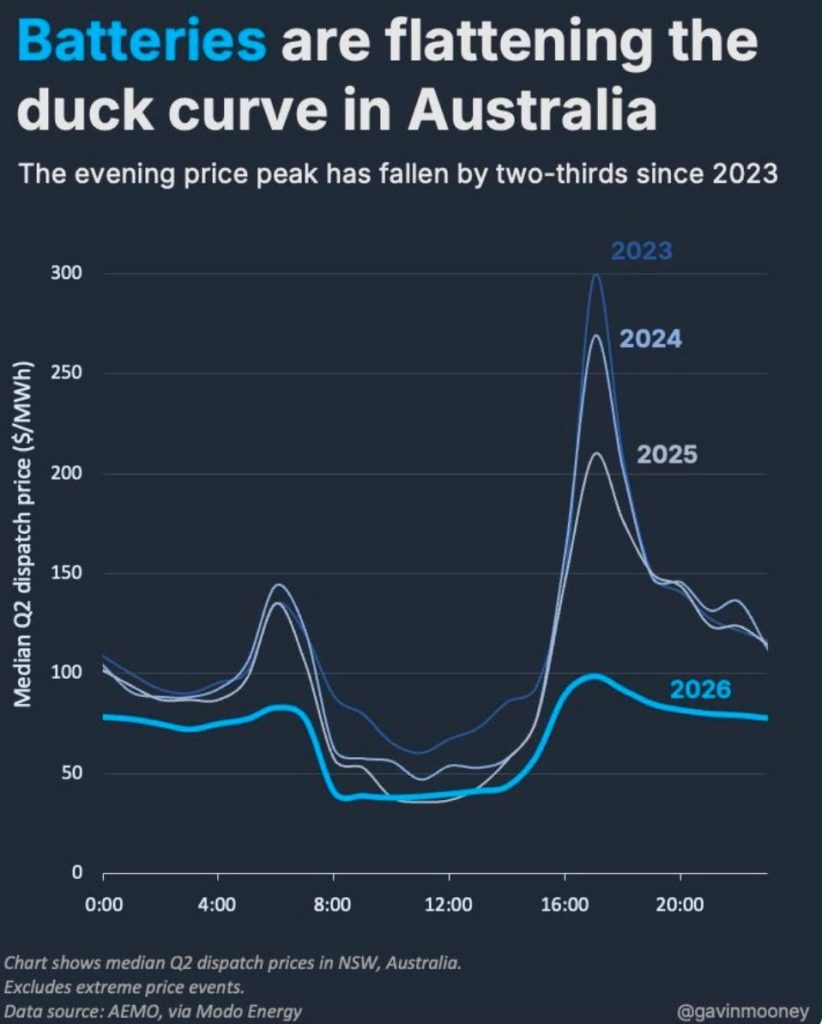
Australia shows what the end of that road looks like. On the New South Wales market, the median second-quarter evening price peak has fallen by around two thirds since 2023 as batteries moved into the evening ramp, on AEMO data compiled by Modo Energy.
The number worth holding on to is this one: across major markets, curtailment losses kept rising even as battery deployment grew. Capacity alone did not stop the losses.
Why BESS Is the Structural Answer to the Duck Curve, and Why Capacity Is Not Enough
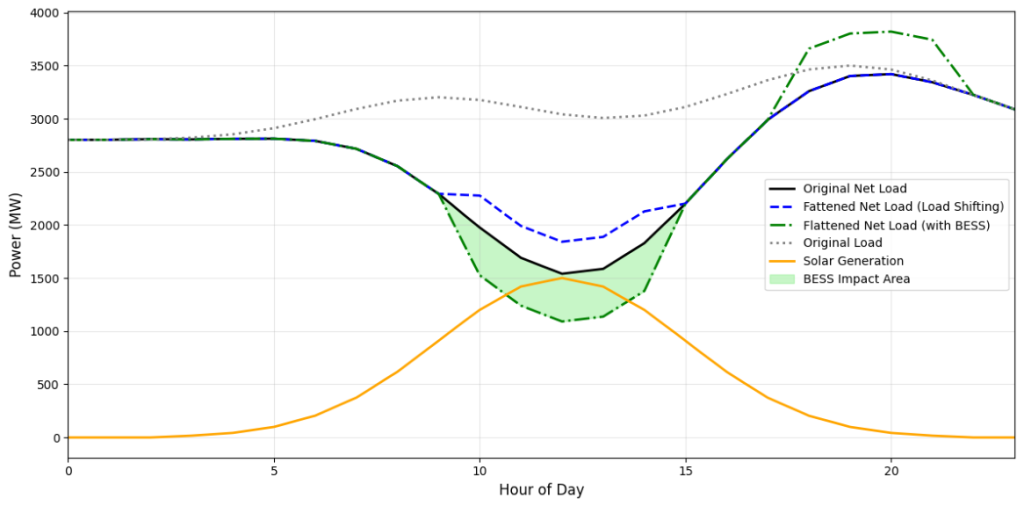
A battery energy storage system co-located with a PV plant addresses the duck curve mechanically. It charges on the midday surplus and discharges through the evening ramp, which flattens the belly and shortens the neck at the same time. Research published in Energies shows that with the right digitalisation and dispatch strategy, storage can support 40-50% penetration of variable renewables with minimal retrofitting of existing infrastructure.
The qualifier in that sentence is the whole point. Not every dispatch strategy performs equally. A study published in Applied Sciences, built on a real utility-scale PV plus storage case in Minas Gerais, tested three intraday dispatch strategies on the same asset. Load derivative compensation, which minimises the hour-to-hour rate of change in net load rather than flattening it to an average, produced the largest reduction in ramp severity. Same battery, same capacity, same state of charge, materially different outcome.
Commercially that difference is the difference between a battery that absorbs deviation penalties and one that creates them. What separates the two is knowing, in advance, when the ramp will happen and how steep it will be.
Forecasting Sets the Dispatch: Why a Better Forecast Makes a BESS Worth More
Solar forecasting is not one product but three horizons, and they are not interchangeable.
Sizing the BESS: the solar climate of the site
Before anything is dispatched, the battery has to be the right size, and that depends on the local solar climate rather than on a regional average. CalibSun FUTURE combines ten years of corrected satellite history with an on-site measurement campaign to produce 5-minute site data and a bankable Typical Meteorological Year. That supports the financing model, and it sets the cycling and rest patterns that protect battery life.
Day-ahead: the plan
Day-ahead solar forecasts rely on numerical weather prediction and on the plant’s own production history, learned by machine learning, projected 24 to 48 hours out. Operators use them to bid capacity into day-ahead markets, to set the target state of charge before the evening ramp, and to declare the schedule required under deviation settlement frameworks in California or India.
A day-ahead forecast pre-positions the battery. It cannot do more than that. The initial state of any weather model, the description of the atmosphere at the moment the forecast starts, contains errors, and those errors grow as the day unfolds.
Intraday: correcting the plan
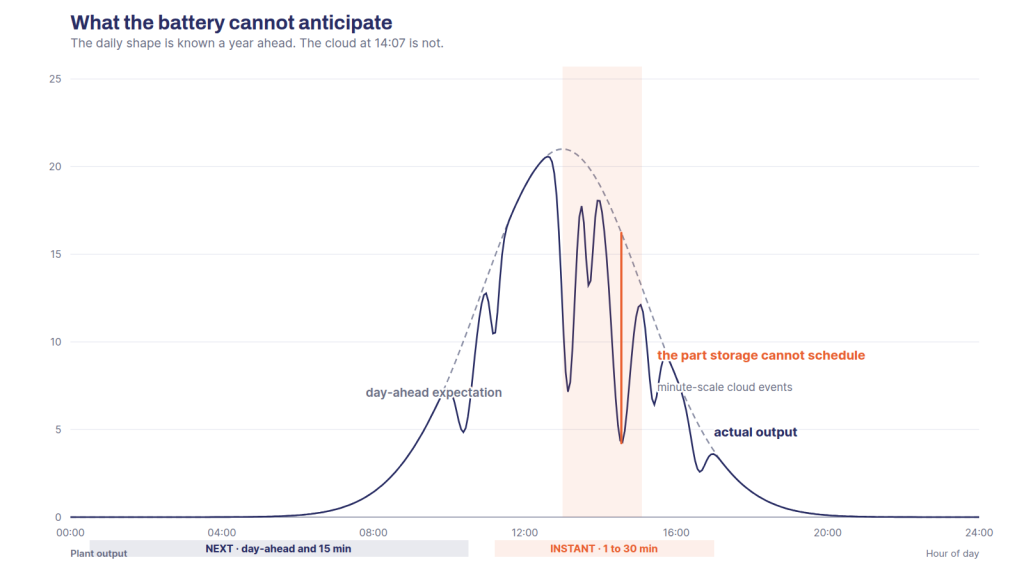
Short-term solar forecasts correct the plan while the day happens. CalibSun NEXT assimilates real-time on-site measurements alongside satellite imagery and numerical weather prediction. Measured on a European IPP portfolio, it cuts forecast error by 46% at 5 minutes and 33% at 15 minutes against the incumbent satellite-based provider. Operators use that to fine-tune the exact minute a charge or discharge starts, to ride through a brief cloud gap without curtailing, and to re-bid intraday when production drifts from the schedule.
Below fifteen minutes, satellite imagery no longer resolves what matters. CalibSun INSTANT covers the one to thirty minute horizon by reading the sky directly, with ground-based cameras on the plant, four per site and ideally seven. It sees cloud shadows before they reach the array, which gives the energy management system the lead time to hold a charge, delay a discharge or re-bid before production drops rather than after.
CalibSun Helps You Manage Your BESS
The duck curve is no longer a Californian curiosity. It is the default net load shape of any PV plus storage market with high solar penetration, and in several regions it has already deepened into a canyon. Storage closes the gap on paper. The actual reduction in curtailment, negative-price exposure and imbalance risk depends on how precisely that storage is dispatched.
The same body of work points to something else. The effect of storage on prices fades as fleets grow: work in Econometrica cited by KfW puts the first 5 GWh of grid-scale capacity at a 5.6% reduction in wholesale prices, while doubling an existing fleet from 25 to 50 GWh adds only 2.6% more. The easy value is taken first.
There is a counter-intuition worth stating plainly. The more valuable a battery’s time becomes, in reserves, in arbitrage or in a firm delivery commitment, the more expensive it is to spend that time covering a forecast error. As fleets grow and the easy midday to evening spread compresses, the margin for error narrows rather than widens. The value of accurate forecasting rises with storage. It does not fall.
CalibSun’s position: turning battery capacity into real duck curve mitigation requires forecast data at the resolution of the ramp itself. Site-specific probabilistic forecasts, calibrated on on-site sensors and updated intraday, let PV plus storage operators pre-position state of charge, limit cycling losses and protect revenue from curtailment and imbalance penalties alike. Ranked first of seven providers across thirty PV sites in a three-month blind benchmark run by the client, a major German IPP, CalibSun forecasts the world’s largest PV plant.
Frequently Asked Questions
Does a BESS eliminate the duck curve?
It flattens it, and in markets like California and New South Wales the evening peak has already fallen sharply. What a BESS cannot remove is the variability that happens faster than it can be scheduled. The daily shape is predictable a year ahead. The cloud at 14:07 is not, and that is where curtailment and imbalance penalties are decided.
Why does forecast accuracy change what a battery earns?
Because a battery only earns on the moment it acts, and a solar forecast is what fixes that moment. A day-ahead forecast sets the plan and the target state of charge. An intraday forecast corrects that plan while the day happens. An error at either horizon is paid for either in curtailed energy, in a missed evening price, or in a deviation penalty. Same battery, same capacity, different revenue.
Does the value of forecasting fall as more storage is built?
It rises. As fleets grow, the easy midday to evening spread compresses, so the margin for error narrows rather than widens, and every hour of battery time becomes more expensive to spend covering a forecast error.
References
Recent data and industry analysis
FactSet Insight, “From Duck to Canyon: How CAISO’s Load Profile Has Evolved” (August 2025)
Green Fuel Journal, “Solar Curtailment Problem: Why Renewable Energy Is Being Wasted in 2026” (April 2026)
PSC Consulting, “The Duck Curve Is Turning Into a Canyon”
KfW Research, Focus on Economics No. 555, “Battery storage is a lever of the energy transition: large-scale storage stabilises electricity prices” (19 August 2026)
AEMO dispatch price data for New South Wales, compiled by Modo Energy (2026)
Scientific and technical research
Applied Sciences (MDPI), “Intraday Dispatch Strategies of Battery Energy Storage Systems to Smooth the Duck Curve: A Real-Life Brazilian Case” (September 2026)
Energies (MDPI), “Smart Grid Strategies for Tackling the Duck Curve: Digitalization, Battery Energy Storage, and Managed Rebound Effects” (July 2025)