




United States (US)
Solar forecasting

Solar forecasting in the United States
A solar plant in the United States is rarely paid for what it produces. It is paid for what it declared, and settled on what it delivered. CAISO makes day-ahead scheduling mandatory and settles every deviation at the five-minute real-time locational marginal price. ERCOT has no capacity market at all, so every megawatt hour runs through the same five-minute settlement.
One number frames the rest of this page. Between January and May 2025, curtailment took 11.5% of Californian solar generation, down from 13% a year earlier but still rising 4.1% in absolute terms. On 29 March 2025 more than 58,000 MWh of solar were curtailed in a single day. Output that cannot be evacuated has to be stored, shifted, or lost.
Market-based procurement now accounts for more than half of utility-scale renewable growth in the United States, mostly corporate power purchase agreements driven by data center and artificial intelligence demand. Half of what is being built will not sit behind an administered tariff.
Seven organized markets, and no national imbalance rule
The United States does not have one electricity market. It has several, and they do not share a rulebook. CAISO, ERCOT, PJM, MISO, SPP, NYISO and ISO-NE each run their own wholesale market and set their own deviation rules. Around them sit the non-organized regions of the Southeast and the West, where vertically integrated utilities plan, procure and dispatch under long-term resource plans instead. The interconnections are largely separate, and Texas runs an independent system.
This is not a mapping detail. It is why a portfolio cannot be scheduled with one method, and why a model calibrated on a national average answers none of these markets.

Solar in the United States: the market in figures
The policy floor moved in July 2025. The One Big Beautiful Bill Act accelerated the phase-out of investment and production tax credits, with commissioning required by 31 December 2027 to qualify. The International Energy Agency cut its United States forecast by almost half in Renewables 2025.
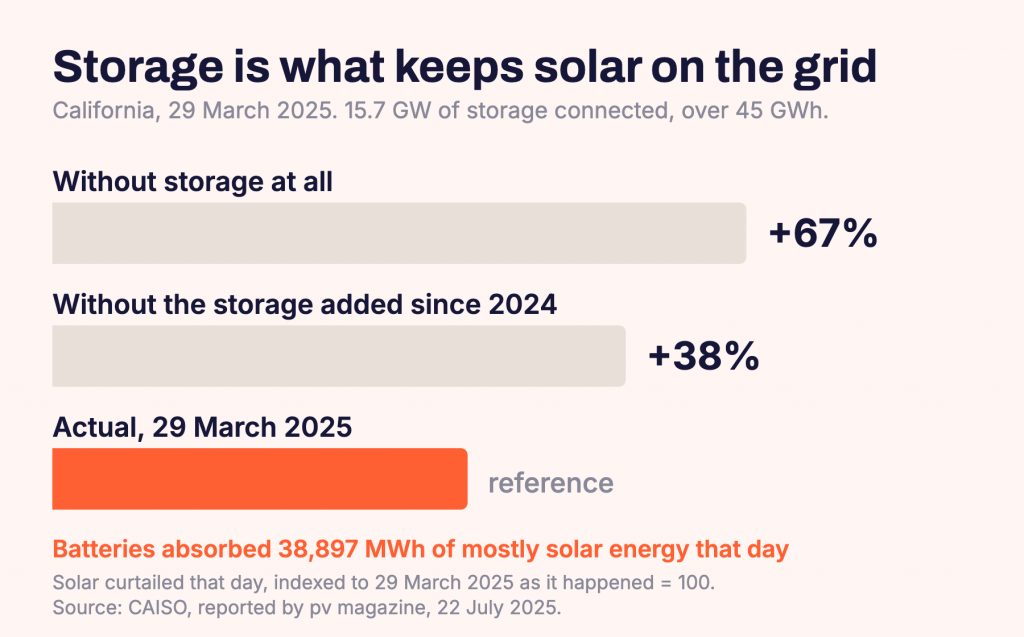
Storage is what keeps that output on the grid. On 29 March 2025, California batteries absorbed 38,897 MWh of mostly solar energy. Without storage at all, curtailment that day would have been 67% higher. Without the storage added since 2024, 38% higher.
Indicator
Value
Source
Cumulative solar capacity
279.2 GWdc at end 2025
Market Data Forecast, 2026
Solar share of United States electricity
About 9% in 2025
Market Data Forecast and Business France
Californian solar curtailed
11.5% of generation, January to May 2025
CAISO, via pv magazine, July 2025
Utility-scale storage connected in California
15.7 GW, over 45 GWh, April 2025
CAISO, via pv magazine, July 2025
United States battery storage
More than 26 GW cumulative, 10.4 GW added in 2024
EIA
Share of growth on market-based procurement
More than 50%, mostly corporate PPAs
IEA, Renewables 2025
Commissioning deadline for tax credits
31 December 2027
One Big Beautiful Bill Act, July 2025
Key context
Two forces point the same way. Half of new capacity carries its own market risk, and the build is compressed into a two-year window. Both raise the value of a schedule that is right at the horizon where the market settles.
Storage, data centers, and the five-minute horizon

Where the value has moved
Storage has become the swing factor. Battery charging demand now lifts the price of midday solar rather than letting it price negative. Aurora Energy Research measured a 42 dollar per megawatt hour uplift on 20 March 2026, against 5 dollars three years earlier when only 0.6 GW of storage was operating. Batteries bought 52,777 MWh that day, worth about 2.2 million dollars more to solar asset owners.
That value is captured or missed inside five minutes. Both CAISO and ERCOT dispatch and settle on a five-minute basis. A storage asset paired with a solar plant decides charge and discharge against the expected profile of the next few intervals, not against a daily total. A forecast that is right at 5 and 15 minutes is what turns curtailment into stored energy instead of lost energy.
Data centers are pulling capacity behind the meter. Announced projects in 2025 include a 2 GW solar and storage campus in southern California, a 1.2 GW co-located campus in Texas, and corporate power purchase agreements of 13.6 GW, 875 MW and 600 MW signed by hyperscalers. A load that runs flat around the clock next to a plant that does not is a forecasting problem before it is an engineering one.
And solar is being asked to answer on short horizons. Where a plant is co-located with storage, the pair can respond to price and to system need within the interval, which is only possible if the next few minutes of production are known.
What changed
The number
What it demands of a forecast
What changed
The number
What it demands of a forecast
Storage lifts the value of midday solar
42 dollars per MWh, March 2026
Know the next intervals, not the day
Storage absorbs what would be curtailed
38,897 MWh in one day in California
Anticipate the ramp before it arrives
Data centers buy directly, often behind the meter
2 GW and 1.2 GW campuses announced in 2025
Match a flat load with a variable plant
Key context
This is the structural point. Storage does not remove the forecasting problem, it moves it. A battery has to be told what to charge and discharge for each five-minute interval, against a forecast of plant output and of what the market will pay. The place where CalibSun is measurably strongest is the place where storage makes its money.

Ramps, coastal cloud, convection and dust
The Southwest desert carries some of the highest irradiance in the country, and with it the steepest ramps: clear conditions broken by fast-moving cloud, on plants large enough that a single cell crossing the array moves tens of megawatts. The California coast adds a marine layer regime, low cloud with no contrast and no visible edge, the condition in which a satellite-derived product has the least to work with. Texas adds deep convection, which builds and decays faster than a weather model update cycle. Dust reduces irradiance across the Southwest in ways satellite products resolve poorly.
The limit is structural. Numerical weather prediction and satellite imagery describe the atmosphere in kilometers and in hours, and geostationary imagery is limited to roughly 3 km and 15 minutes. The cloud about to cross a specific array sits below both.
Region
Dominant regime
What a satellite product misses
Region
Dominant regime
What a satellite product misses
Southwest desert
Steep ramps under high irradiance
A single cell crossing a large array, in minutes
California coast
Marine layer, low cloud without contrast
No visible edge to track between frames
Texas
Deep convection
Cells build and decay faster than the model cycle

Where the gap sits, and why a battery needs it
In an independent comparison of normalized mean absolute error from 5 minutes to 8 hours ahead, NEXT reduced error by 46% at the 5-minute horizon against the incumbent forecasting provider, by 33% at 15 minutes and by 18% at 90 minutes.
Those are the horizons a battery is dispatched on and the horizons CAISO and ERCOT settle. Beyond a few hours every provider converges on the same weather models and the gap closes. Both benchmarks behind these figures were run outside the United States. We say so plainly. What transfers is the method and the horizon where it wins, not the site.
Horizon
What the market uses today
Where the gap sits
Horizon
What the market uses today
Where the gap sits
Day-ahead
Numerical weather prediction
Adequate at plant level
Intraday, one to four hours
NWP and satellite imagery
Local microclimate not resolved
One minute to one hour
No effective coverage
Cloud motion below satellite resolution
Pre-construction resource
Satellite databases only
No on-site measurement to calibrate
Key context
The advantage is concentrated in the first hour. That is where an intraday position is corrected, where a battery is committed, and where a deviation is settled.
CalibSun in the United States: on-site data where the models stop
Numerical weather prediction and satellite imagery describe the atmosphere in kilometers and in hours. The cloud about to cross a specific array sits below both. CalibSun measures it from the ground.
INSTANT, second-scale nowcasting for ramp events
Hemispherical fisheye sky imagers on the plant capture approaching cloud that satellite imagery and irradiance sensors do not resolve. INSTANT updates every minute, covers one to 30 minutes ahead, and feeds the energy management system or the trading platform directly.
At the Loulo gold mine in Mali it has run continuously and unattended since August 2020. Phase one carried photovoltaic capacity on a 65 MW heavy fuel oil and diesel grid with no storage at all, avoiding 15.6 million litres of fuel, or 42,050 tonnes of CO2 equivalent, per the operator report for the first quarter of 2022. Solar was later tripled to 72 MWp and a battery added.
NEXT, intraday and day-ahead accuracy where it is settled
NEXT covers the horizons CAISO and ERCOT actually settle, from intraday revision through day-ahead scheduling. It is software only, connected to an existing SCADA feed by API or SFTP, with no hardware on site. Forecasts are deterministic and probabilistic, with calibrated quantiles from P5 to P95 per 15-minute block.
FUTURE, on-site measurement for bankable yield
Before construction, a long-term yield estimate usually rests on satellite irradiance data alone, which carries an error of around 5% on any given site. FUTURE runs an autonomous measurement station on site for twelve continuous months at 5-minute resolution, then calibrates the long-term satellite record against what the site actually receives. Satellite database error falls from around 5% to 0.5%, and the P90 over P50 ratio improves by around 2.5%, which is the uncertainty a lender prices into the debt.
Need more information?
Get in touch!

- Questions
Frequently Asked Questions
Why does forecast accuracy show up in revenue in ERCOT and CAISO rather than in a compliance score?
Because both settle deviation at the five-minute real-time price. ERCOT is energy-only, with no capacity payment, so every megawatt hour is exposed directly. CAISO requires a day-ahead schedule and settles the gap at real-time nodal prices. The error lands on the settlement statement, not in a report.
Does the United States have a single national imbalance rule for solar plants?
No. Each ISO and RTO sets its own wholesale market rules and its own treatment of deviation, and revises them. The non-organized regions of the Southeast and the West have no centralized market at all: exposure there runs through time-of-use tariffs, demand charges and export compensation.
What does storage change for a solar forecast?
It moves the problem rather than removing it. A battery decides charge and discharge for each five-minute interval, against a forecast of plant output and of what the market will pay. On 29 March 2025 Californian batteries absorbed 38,897 MWh of mostly solar energy that would otherwise have been curtailed. Getting the next intervals wrong means arbitraging the wrong way.
Does INSTANT require permanent staff on site?
No. The imagers and the acquisition system are built for unattended operation on industrial and remote sites. CalibSun has run this configuration continuously since 2020 on an off-grid mining microgrid in Mali.
Regulatory and market information. Information on wholesale market rules, scheduling obligations, deviation settlement and curtailment treatment is provided for general guidance only. In the United States these rules are set by each ISO or RTO, or by the competent utility and state regulator in non-organized regions, and are revised regularly. Any threshold, range or mechanism described on this page is indicative and non-contractual, reflects general industry practice at the date of publication, and does not constitute legal, regulatory or financial advice. Market figures are drawn from public sources at the dates indicated and may have been revised since. Operators should verify the rules applicable to their own interconnection point with the competent market operator before relying on them. Curtailment and storage figures for California are drawn from CAISO data as reported by pv magazine on 22 July 2025, and market value figures from Aurora Energy Research as reported by pv magazine on 9 April 2026. Data center projects listed are publicly announced projects, not CalibSun references. CalibSun accepts no liability for decisions taken on the basis of this page.