en
en 
 fr
fr es
es de
de
Backtesting NEXT's forecast performance
 13 Jun 2024
 13 Jun 2024
Backtest methodology
Know more about the methodology behind and the results of the backtest (performance test) on our solar forecasting service NEXT
Backtesting methodology in 5 steps
1) Measurement dataset
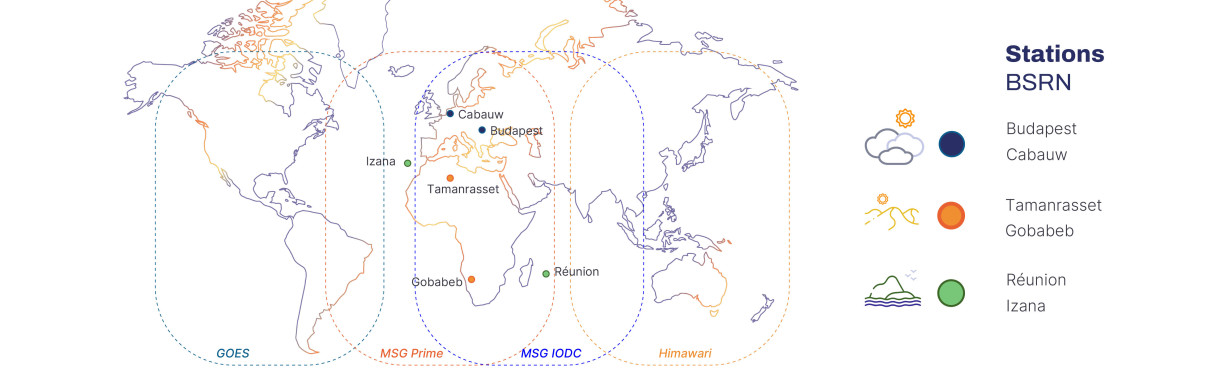
The first step is to collect 2 years of historical data (2022-2023): satellite images, meteorological models and on-site data from stations in the BSRN (Baseline Surface Radiation Network) scientific network. Calibsun selected these weather stations because they provide accessible and high-quality datasets that are widely used as references in scientific literature around the world.
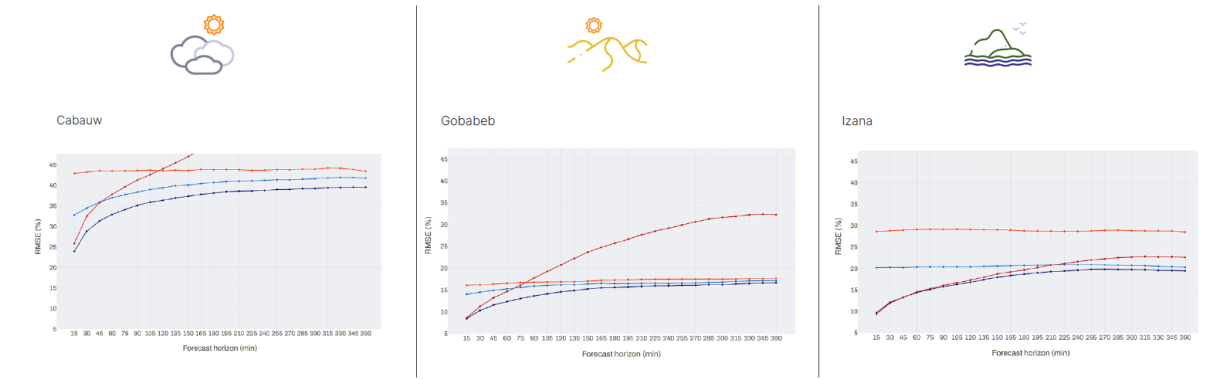
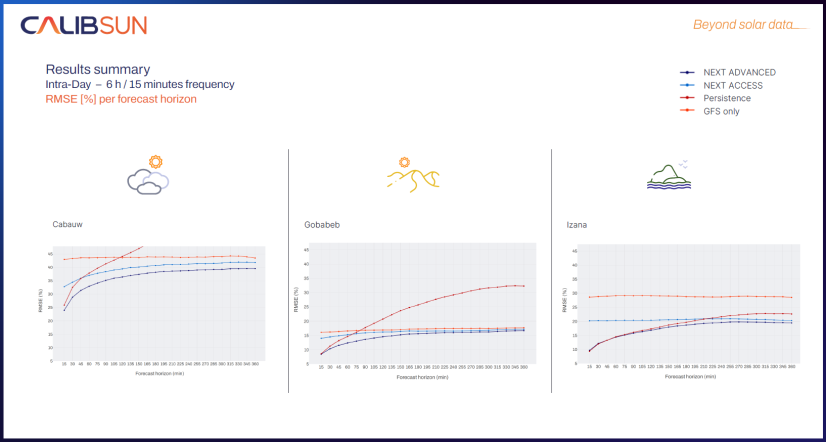
To carry out these performance tests, Calibsun selected 6 BSRN measurement stations located in different climates:
- Tamanrasset and Gobabeb are located in a desert climate.
- Budapest and Cabauw have a continental climate.
- La Réunion and Izana correspond to island or mountain climates.
This variety of climates allows us to test the effectiveness of our forecasts in very different and changing conditions, as explained in our article "Forecast uncertainty in different climates" on our Linkedin Page.
2. Quality check
To provide optimum forecasts and remove sources of uncertainty resulting from measurement errors, Calibsun performs an in-situ data quality check. To ensure reproducibility, this check is largely based on the Quality Check recommendations published in a best practice guide drawn up by the IEA PVPS Task 16 group of experts.
The aim of quality control is to remove from the data history used for backtesting, any measurements detected as incorrect, distorted or suspicious. Indeed, the results of these tests could add a source of error not inherent to the forecasting method itself.
Download the report for more information (Task 16 PVPS - page 127) : https://iea-pvps.org/wp-content/uploads/2024/05/PVPS_Annual_R...
3. Backtest
Following quality checks on the data, the backtests are launched.
1) NEXT's algorithm is trained by machine learning on the year 2022 (the year preceding the forecast year).
2) The NEXT Access and NEXT Advanced services simulate forecasts for the year 2023, using for each simulation the latest data to which they would have had access in operational condition.
The NEXT Access forecasting model uses meteorological data, solar geometry data and satellite images. The NEXT Advanced model uses real-time on-site measurements in addition to all these data.
These simulations are carried out for intra-day with a forecast resolution of 15 minutes and a maximum horizon of 6 hours, as well as for day-ahead with a resolution of one hour and a maximum horizon of 48 hours.
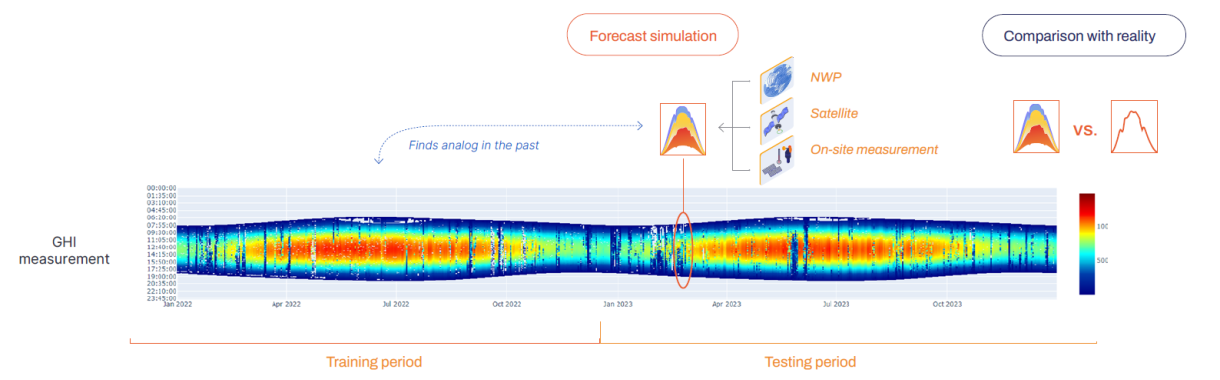
3) The forecasts obtained are compared with actual measurements for the year concerned (real conditions on site) and compared with two reference models: GFS and Smart Persistence.
- GFS weather models: This is a high-performance global weather forecasting model supplied by the US Meteorological Agency. It provides forecasts for a range of meteorological parameters, including ground radiation, with worldwide coverage and frequent updates.
- Smart persistence: Consists in maintaining the current cloud cover over time by keeping constant the cloud index observed in the last available on-site measurement.
Formula: ∀𝑘∈[1, 𝑛], 𝐾_𝑐 (𝑡+𝑘∗𝑑𝑡)=𝐾_𝑐 (𝑡)
4. KPI’s : RMSE
The performance of our NEXT Access and NEXT Advanced services, as well as GFS and smart persistence, is measured in RMSE (Root-Mean-Square Error). This is a measure commonly used by weather forecasting professionals to compare the errors of predictive models with reality. RMSE assesses forecast accuracy by comparing predicted weather conditions with actual observed conditions. It gives a clear idea of the average difference between the forecast and the actual measurement observed a posteriori. When RMSE is low, forecasts are close to reality, indicating better performance.
Other key performance indicators have been calculated and are available on request.
Comparison : results
Improved RMSE WITH NEXT ADVANCED
NEXT Advanced is always better than the reference models (smart persistence and GFS), regardless of the time horizon and type of climate.
The accuracy of intraday forecasts is greatly improved by real-time on-site measurements :
NEXT Advanced vs. GFS (% of RMSE improvement) :
- In a continental climate, the use of Next Advanced improves RMSE by up to +40% compared with reference models.
- Up to +35% for a desert climate.
- Up to +45% for mountain and island climates.